The essence of this technique is to classify organizations according to the level of financial risk, that is, any analyzed organization can be assigned to a certain class depending on the number of points “scored”, based on the actual values of its financial ratios.
1st class– these are organizations with absolute financial stability and absolutely solvent, whose financial condition allows us to be confident in the timely fulfillment of obligations in accordance with contracts. These are organizations that have a rational structure of property and its sources, and, as a rule, its sources are quite profitable.
2nd class– these are organizations with normal financial condition. Their financial indicators as a whole are very close to optimal, but some lags are allowed in certain ratios. These organizations, as a rule, have a suboptimal ratio of their own and borrowed sources of financing, shifted in favor of borrowed capital. At the same time, there is a rapid increase in accounts payable compared to the increase in accounts receivable. These are usually profitable organizations.
3rd grade– these are organizations whose financial condition can be assessed as average. When analyzing the balance sheet, the “weakness” of individual financial indicators is revealed. Either their solvency is on the border of the minimum acceptable level, and their financial stability is normal, or, on the contrary, they have an unstable financial condition due to the predominance of borrowed sources of financing, but there is some current solvency. When dealing with such organizations, there is hardly a threat of loss of funds, but the fulfillment of obligations on time seems doubtful.
4th grade– these are organizations with an unstable financial condition. There is a certain financial risk when dealing with them. They have an unsatisfactory capital structure, and their solvency is at the lower limit of acceptable values. Such organizations, as a rule, have no profit at all or very little, sufficient only for mandatory payments to the budget.
5th grade– these are organizations with a crisis financial condition. They are insolvent and completely unsustainable from a financial point of view. These enterprises are unprofitable.
Determine the class of an enterprise by level of financial condition in the form of Table 2.
Table 2 - Determination of the class of an enterprise by level of financial condition
| Financial condition indicators | I year | II year | III year | |||
| Meaning | Points | Meaning | Points | Meaning | Points | |
| Absolute liquidity ratio | ||||||
| "Critical" rating coefficient | ||||||
| Current ratio | ||||||
| Share of working capital in assets | ||||||
| Own funds ratio | ||||||
| Capitalization rate | ||||||
| Financial Independence Ratio | ||||||
| Financial stability ratio | ||||||
| TOTAL | ||||||
| Class |
Clause 1.3
Express analysis on the scale of financial and economic stability (based on identifying deviations from the equilibrium point)
Classification of enterprise property. The property of the enterprise from the point of view of functional participation in the reproduction process is divided without remainder into financial and non-financial assets. From the point of view of property relations, it is divided into equity and borrowed capital.
This characteristic of property in economic sectors is provided for in the System of National Accounts (SNA). Since sectors are formed by a set of enterprises, the principle of dividing economic assets into financial and non-financial, and capital into own and borrowed, is logical to apply to each individual enterprise. Moreover, this provides the opportunity to carry out a deep financial and economic analysis of the property, income and economic resources of the enterprise as a whole.
Financial assets are economic assets that are reflected simultaneously in the balance sheet of this and some other enterprise or financial organization: for this enterprise - as an asset, and for another - as a liability.
Non-financial assets reflected only in the balance sheet of this enterprise.
Financial assets include cash, accounts receivable (funds in settlements), short-term and long-term financial investments: loans provided, deposits, securities, shares and other investments in the capital of other enterprises.
Non-financial assets include property, plant and equipment, intangible assets, inventories, work in progress and construction in progress.
Non-financial assets are real property. Financial assets are the right to property, a set of claims, a duplicate of real property that is in use by other owners.
Each security or accounts receivable record corresponds to real assets included in the borrowed capital of other enterprises. To obtain the full amount of all real property in a country, economic sector, industry, it is necessary and sufficient to sum up non-financial assets. For each economic entity, on the contrary, the amount of both financial and non-financial assets is important.
A natural question arises: what real property is behind the banknotes located in the cash register of the enterprise, or behind the sums of money stored in the bank account?
Banks act as debtors to the owners of funds (cash and non-cash) and are responsible to them as to their creditors with their own assets.
Both banknotes and non-cash funds are backed, firstly, by the reserves of the state banking system, which represent gold and foreign exchange reserves, i.e. real values, and, secondly, by investments of commercial banks in non-financial assets by providing loans to their clients .
Both financial and non-financial assets of an enterprise can be either own or borrowed. Both are at the disposal of the enterprise. None of the asset items bears any mark or identification mark - whether it relates to own property or borrowed property. This can only be determined by ranking, outside the scope of accounting. Own property is accounted for in an enterprise, regardless of its form of implementation, as the sum of authorized capital, additional capital, reserve capital, retained earnings, and targeted financing. Borrowed capital is accounted for as the sum of bank loans, borrowed funds received from other organizations, trade credit, advances received from customers, debt to the budget, founders and personnel (respectively, for payments of taxes, dividends and wages).
The double-entry accounting method guarantees at the end of each reporting period the balance (equality) of the amount of non-financial and financial assets, on the one hand, and the amount of equity and borrowed capital, on the other. But at the same time, there is no answer to the most pressing question: the funds in the current account – whose? Your own or borrowed? If it is not your own money, then it should be spent as follows:
· pay wages.
If it is your own money, then you have a choice:
· finance a conference (festival, seminar);
· update outdated equipment;
· decorate the office according to the latest European-quality renovation;
· issue bonuses to employees.
Making a decision - choosing from the listed options for spending money - does not, of course, depend on analysis. If the analyst discards a number of options and ranks the remaining ones, the manager may still choose the option from among the discarded ones. But at least the manager will know what he now owes to himself, since the expenditure of funds is ahead of their inflow.
In the further presentation we will proceed from the fact that financial and economic analysis is carried out with the aim of practical use of its results in financial management.
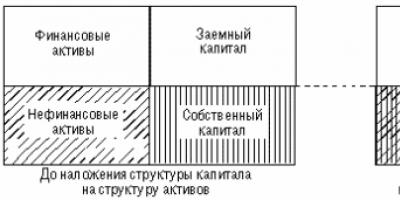
The procedure for overlaying enterprise capital with economic assets. The procedure that must be followed when conducting a rapid analysis of financial stability on a particular date is the imposition of the capital structure on the structure of economic assets. In this case, the rule is observed: equity capital is superimposed on non-financial assets and is commensurate with them. Consequently, debt capital absorbs the remaining assets. When you first approach this procedure, there are three options:
· equity capital is greater than non-financial assets (correspondingly, borrowed capital is less than financial assets), Fig. 1;
· equity capital is equal to non-financial assets (correspondingly, borrowed capital is equal to financial assets), Fig. 2;
· equity capital is less than non-financial assets (correspondingly, borrowed capital is more than financial assets), Fig. 3.
Figure 1 – Net lending

Figure 2 – State of financial and economic equilibrium

Figure 3 – Net borrowing
From a comparison of three possible options in a static analysis of an enterprise’s property, the following conclusions follow:
1. Non-financial assets bind equity.
2. Borrowed capital absorbs financial assets.
3. An enterprise has its own financial assets only if its own capital exceeds non-financial assets.
4. If equity capital is less than non-financial assets, then borrowed capital absorbs not only financial assets, but also part of the non-financial assets.
5. If equity capital is equal to non-financial assets, the enterprise is in a state of financial and economic equilibrium (Fig. 2).
6. The presence of own financial assets indicates the state of net lending (Fig. 1).
7. The presence of borrowed non-financial assets indicates the state of net borrowing (Fig. 3).
Thus, financial and economic analysis begins not with financial assets, but with non-financial assets, since equity capital must finance the least liquid assets. This is understandable: illiquid Assets cannot cover obligations, since they cannot pay off debts, in any case, pay off without damage to the technological process and without economic losses. If you still have to urgently sell non-financial assets (inventories, equipment), then you have to sell them below cost (economic value), i.e. at a loss. The financial situation is stable only when the threat of sale does not hang over the real (non-financial) property of the enterprise. And this is only possible if the equity capital is sufficient to finance (secure) all non-financial assets.
Own financial assets are a control lever. Net lending and net borrowing are new concepts for financial analysis of enterprises, taken from the macroeconomic analysis of economic sectors in the SNA. Net lending does not mean that the entire excess of equity over non-financial assets represents receivables. (In this case, this enterprise would indeed be a direct creditor to its debtors). Own financial assets can take the form of non-cash and cash funds, financial investments, and foreign currency savings. But all this is evidence that this enterprise indirectly, through third legal entities, primarily through banks, lends to those economic entities whose analysis shows a state of net borrowing. Net borrowing means the lack of security of non-financial assets with equity capital, their use to cover the obligations assumed by the enterprise.
Own financial resources are a control lever, a means of financial maneuver. They can be provided to partners on credit, invested in your own business or invested at favorable interest rates in a bank, made emergency (unscheduled) expenses, advanced to suppliers, and finally, lent to yourself if debtors fail to pay for orders on time.
An enterprise is potentially ready to invest in production only if it has its own financial assets, since investing in machinery, equipment, buildings, and land transforms financial assets into non-financial assets. In order not to lose financial and economic balance, investments in production should not exceed one’s own financial resources. By investing with borrowed funds, the company takes on increased risk and loses balance. Such options are possible and sometimes necessary. But at the same time, one should be aware of what is happening with financial and economic sustainability.
The outlined approach to financial and economic analysis outlines its contours and provides a theoretical basis. For the practical implementation of financial and economic analysis, additional specification of this method is necessary, in particular, its application in statics and dynamics. Rules for extracting source information from the balance sheet are required.
In both cases, it is important to adhere to the line that the difference between equity and any part of the assets (financial or current) can be either positive or negative. In both cases, the difference is only an indicator. Neither working capital nor own financial assets can be a negative value, since they are a real component of a positive value - capital invested in the business, in turnover. The limit value of both working capital and own financial assets is zero.
Summarize. A negative difference between equity and non-current assets is an indicator of working capital, an indication that it is absent. The value of the indicator indicates how much equity capital is missing to achieve equilibrium, but in this case there is no working capital.
The negative difference between equity and non-financial assets is an indicator of financial and economic stability. It indicates the absence of one’s own financial assets and the amount that one’s own capital lacks in order to have financial and economic balance.
With positive indicator values, no special explanation is required, since the value and sign of the indicator coincide with either working capital or own financial assets. Please note: they are the same, but not identical.
The concepts of net lending and net borrowing fit into the general system of financial and economic equilibrium in the economy. In the SNA, financial investments, included in accounting as non-current assets, are included in the mechanism for achieving financial and economic equilibrium, which is dictated by the real conditions of the capital market and theoretical provisions. In fact, if an enterprise has securities, such as shares of Gazprom or Lukoil, does it have real estate? Does it tie up its own capital? On the contrary, it is a very mobile, easily sold part of assets, which can provide “quick liquidity” better than any reserves.
Deepening the static analysis of financial and economic sustainability. Let us continue the analysis of financial and economic stability in statics. Let us divide financial assets into mobile and non-mobile, and non-financial assets into illiquid and liquid. Will compare equity capital alternately with immobile assets, non-financial and illiquid (Fig. 4). In this case, five states of financial and economic stability will arise: super stability, stability, equilibrium, financial tension and a risk zone (on the verge of a crisis state).
Each of the quantities involved in the analysis can vary within certain limits. Let us introduce the designations for these quantities and their derivatives:
EA – economic assets;
K – capital;
SK – equity capital;
ZK – borrowed capital;
MFA – mobile assets (financial);
NMFA – immobile financial assets;
Intangible assets – immobile assets (financial and non-financial);
FA – financial assets;
NA – non-financial assets;
LA – liquid assets (financial and non-financial);
LHA – liquid non-financial assets;
NLHA – illiquid (non-financial) assets;
I – indicator of financial and economic stability:
I" – indicator of absolute solvency:
I" = SK-NMA;
And "" – security indicator:
I"" = SK-NLNA.

Figure 4 – Graphic scale of financial and economic stability
In Fig. 4 indicates the critical points of transition from one zone to another; between these points, equity capital has upper and lower limits. As can be seen from the diagram, all capital can be owned, just as it can be entirely borrowed, but it cannot have a negative value. At the point of transition from the risk zone to the crisis zone, borrowed capital is equal to all assets, and below it becomes more than assets. This is an economic sign of crisis. The balance is broken. Capital is not equal to assets. Part of the borrowed capital has been lost, “eaten up” - after the own.
Let us present a table (Table 3), which reflects the “behavior” of all indicators characterizing financial and economic stability by zone and which can be used as a scale for establishing the rank of an enterprise in statics. The enlarged scale can have three ranks:
1. Sustainability;
2. Balance;
3. Instability.
The differentiated static scale contains five ranks:
1. Super stability;
2. Sufficient stability;
3. Balance;
5. State of risk.
Table 3 – Static scale-table of financial and economic stability (FES)
| Enlarged scale | Differentiated scale |
| Stability zone: ON < SK < EA I > 0 | Super resistance zone: NMA< СК < EA; I > 0; I" > 0; I" > 0 |
| Absolute solvency line: SC = intangible asset; ZK = MFA; I > 0; I" = 0; I" > 0 Zone of sufficient stability: ON < SK < NMA AND > 0; AND" < 0; I" > 0; | |
| Equilibrium line: I = 0 Instability zone: 0 < SK< НА И < 0 | Equilibrium line: SC = NA; ZK = FA; I = 0; AND"< 0; И" >0 NLNA tension zone < SK< НА; И < 0; И" < 0; И" > 0; |
| Liquidity line: SC = NLNA; ZK = LA; AND< 0; И" < 0; И" = 0; Зона риска: 0 < SK< НЛНА И < 0; И" < 0; И" < 0. |
Dynamic scale of financial and economic stability. The dynamics of financial and economic stability are measured by the increases in the indicators mentioned above (Table 3). The combination of positive, negative and zero values of the incremental indicators of the photomultiplier determines the transition from one state to another. These transitions can be ranked. The three states of the photomultiplier in statics correspond to a scale with 13 dynamics characteristics (Table 4).
Table 4 – Enlarged dynamic scale of PMT
| Transition Characteristics | PMT indicator value | Rank | ||
| At the beginning of the reporting period (I 0) | At the end of the reporting period (I 1) | Incremental indicator (ΔI) | ||
| Strengthening Resilience | > 0 | >0 | > 0 | |
| Maintaining sustainability | > 0 | > 0 | = 0 | |
| Weakening stability | > 0 | >0 | < 0 | |
| Transition from balance to stability | = 0 | > 0 | >0 | |
| Transition from instability to sustainability | < 0 | > 0 | > 0 | |
| Transition from stability to balance | > 0 | = 0 | < 0 | |
| Maintaining balance | = 0 | = 0 | = 0 | |
| Transition from instability to equilibrium | < 0 | = 0 | > 0 | |
| Transition from stability to instability | > 0 | < 0 | < 0 | |
| Loss of balance | = 0 | < 0 | < 0 | |
| Reducing instability | < 0 | < 0 | > 0 | |
| Preservation of instability | < 0 | < 0 | = 0 | |
| Increasing instability | < 0 | < 0 | < 0 |
The incremental indicators of the FEU (I) indicator in 13 transition types are combined with certain incremental values of each of the six indicators: SC, ZK, K, NA, FA, EA. All seven incremental indicators can be > 0, = 0,< 0. При заданных условиях возникает 75 приростных ситуаций, которые образуют целостный массив и организованы в 13 блоков. Все ситуации различаются между собой. Среди них нет двух одинаковых. Вместе с тем, доказано, что иных ситуаций сбалансированных приростов, кроме этих 75, более нет (Приложение А).
Using an array of standard situations, you can use express analysis mode, given the values of some indicators, to find the direction of changes in others. First, they find the desired block, one of 13, using the elimination method. Then - the desired situation, of which there can be 7, 5 or 3 in one block. This method imposes restrictions on unreasonable decision-making and excludes obviously incompatible intentions.
It is impossible, for example, to combine the intensive use of trade credit with the intention of forming one’s own financial assets, etc. In practice, the incompatibility of indicators is not as obvious as in the above example, especially since the seven indicators mentioned above often move in different directions. In addition to the array of standard situations in the incremental analysis of the FEM, it is possible to use similarly constructed arrays of situations in the incremental analysis of absolute solvency and security.
Clause 1.4
In the scientific literature, find another approach to analyzing the financial condition of an enterprise (including taking into account the specifics of the industry of the subject of the course work research). Describe the approach found and analyze the financial condition of the enterprise using this approach.
SECOND CHAPTER
Clause 2.1
At this point, it is necessary to conduct a detailed comparative analysis of the financial analysis techniques discussed in the first chapter. The advantages and disadvantages of each technique should be identified.
Clause 2.2
At this point of the coursework, taking into account the results of various methods, it is necessary to draw a conclusion about the financial condition of the research object and propose measures to improve it. The content of these proposals must be clearly stated and reasoned.
Related information.
Boundaries of classes of organizations according to the criteria for assessing financial condition
(methodology)
|
Index |
Conditions for reducing the criterion |
Class boundaries according to criteria |
||||
|
Absolute liquidity ratio |
0.70 or more => |
0.69 – 0.50 => from 13.8 up to 10 points |
0.49 – 0.30 => from 9.8 to 6 points |
0,29 – 0,10 => from 5.8 to 2 points |
Less than 0.10 =>from 1.8 up to 0 points |
|
|
"Critical" rating coefficient |
For every 0.01 point reduction, 0.2 points are deducted |
1 or more => 11 points |
0.99 – 0.80 => from 10.8 to 7 points |
0.79 – 0.70 => from 6.8 to 5 points |
0.69 – 0.60 => from 4.8 to 3 points |
0.59 or less => from 2.8 to 0 points |
|
Current ratio |
For every 0.01 point reduction, 0.3 points are deducted |
2 or more => 20 points 1.70 – 2.0 => 19 points |
1.69 – 1.50 => from 18.7 to 13 points |
1.49 – 1.30 => from 12.7 to 7 points |
1.29 – 1.00 => from 6.7 to 1 points |
0.99 or less => from 0.7 to 0 points |
|
Share of working capital in assets |
0.5 or more =>10 points |
0.49 – 0.40 => from 9 to 7 points |
0.39 – 0.30 => from 6.5 to 4 points |
0.29 – 0.20 => from 3.5 to 1 points |
Less than 0.20 => from 0.5 to 0 points |
|
|
Coefficient security own sources financing |
For every 0.1 points reduction by 0.3 points |
0.5 or more =>12.5 points |
0.49 – 0.40 => from 12.2 to 9.5 points |
0.39 – 0.20 => from 9.2 to 3.5 |
0.19 – 0.10 => from 3.2 to 0.5 points |
Less than 0.10 => |
|
Coefficient financial independence |
For every 0.01 point reduction, 0.4 points are deducted |
0.50 – 0.60 and more => from 9 to 10 points |
0.49 – 0.45 => from 8 to 6.4 points |
0.44 – 0.40 => from 6 to 4.4 points |
0.39 – 0.31 => from 4 to 0.8 points |
0.30 or less => from 0.4 to 0 points |
|
Coefficient financial sustainability |
For every 0.01 point reduction, 1 point is deducted |
0.80 or more =>5 points |
0.79 – 0.70 => 4 points |
0.69 – 0.60 => 3 points |
0.59 – 0.50 => 2 points |
0.49 or less => from 1 to 0 points |
|
Class boundaries |
100 – 97.6 points |
93.5 – 67.6 points |
64.4 – 37 points |
7.6 – 0 points |
||
Appendix 14
Table 20.1
Brief description of classes of organizations according to the criteria for assessing financial condition (methodologyDontsova L.V. and Nikiforova N.A.)
|
Class name |
A brief description of |
|
Organizations with absolute financial stability and absolutely solvent, whose financial condition allows us to be confident in the timely fulfillment of their obligations in accordance with contracts. These are organizations that have a rational structure of property and its sources and, as a rule, are quite profitable |
|
|
Organizations in normal financial condition. Their financial indicators as a whole are very close to optimal, but there is some lag in certain ratios. They usually have a suboptimal ratio of their own and borrowed sources of financing in favor of borrowed capital. Moreover, there is a rapid increase in accounts payable compared to the increase in other borrowed sources. And also in comparison with the increase in accounts receivable. These are usually profitable organizations. |
|
|
Organizations whose financial condition can be assessed as average. When analyzing the balance sheet, the weakness of certain financial indicators is revealed. Either their solvency is on the border of the minimum acceptable level, and their financial stability is normal, or, on the contrary, they have an unstable financial condition due to the predominance of borrowed sources of financing, but there is some current solvency. When dealing with such organizations, there is hardly a threat of loss of funds, but their fulfillment of obligations on time seems doubtful. |
|
|
Organizations with an unstable financial condition. There is a certain financial risk when dealing with them. They have an unsatisfactory capital structure, and their solvency is at the lower limit of acceptable values. Such organizations, as a rule, have no profit at all or very little, sufficient only for mandatory payments to the budget. |
|
|
Organizations with a financial crisis. They are insolvent and completely unsustainable from a financial point of view. These enterprises are unprofitable. |
Appendix 16
Table 21
Calculation of coefficients for financial assessment of enterprise activities (methodology of R.S. Saifullin and G.G. Kadykov)
|
Characteristics of the coefficient |
Name of the coefficient (method of R.S. Saifullin and G.G. Kadykov) |
|||||||||||||||||
|
TO 1 |
TO 2 |
TO 3 |
TO 4 |
TO 5 |
||||||||||||||
|
What does it show |
Characterizes the sufficiency of the enterprise's own working capital necessary for financial stability. |
Characterizes the expected solvency for the period, shows the payment capabilities of the enterprise |
Talks about the efficiency with which the company uses its resources to produce products |
Reflects how many monetary units of net profit each monetary unit of sold products brought in |
Characterizes the efficiency of capital use and shows how much net profit the enterprise has from the ruble advanced into capital |
|||||||||||||
|
Calculation method |
|
|||||||||||||||||
|
Calculated values |
||||||||||||||||||
Analysis of financial statements. Dontsova L.V., Nikiforova N.A.

2nd ed. - M.: 2004. - 336 p.
The textbook substantiates the theoretical, methodological and practical provisions of the modern concept of analyzing the financial statements of business entities. Based on the latest regulatory documents, the authors detail the methodology for compiling and analyzing Form No. 1 “Balance Sheet”, Form No. 2 “Profit and Loss Statement”, Form No. 3 “Statement of Changes in Capital”, Form No. 4 “Cash Flow Statement” ”, Form No. 5 “Appendix to the Balance Sheet”, Form No. 6 “Report on the intended use of funds received” by quarter and for the reporting period as a whole. The presented material is illustrated with an end-to-end digital example.
The publication is addressed to teachers and students of economic universities, employees of accounting services, financial directors, as well as students in the system of training and certification of professional accountants and auditors.
Format: djvu
Size: 10MB
Download: drive.google
TABLE OF CONTENTS
PREFACE 3
1. FINANCIAL (ACCOUNTING) REPORTING - INFORMATION BASE FOR FINANCIAL ANALYSIS 5
1.1. Purpose, basic concepts, tasks of financial reporting analysis 5
1.2. Concept, composition and procedure for filling out financial (accounting) reporting forms 10
1.2.1. About the scope of financial statements 11
7.2.1. Requirements for the reliability of reporting 13
7.2.3. Users of financial statements 15
12.4. Reporting period and reporting date 17
1.2.5. Procedure for drawing up reporting forms 18
1.2.6. The role of the explanatory note in information disclosure 23
12.7. Procedure for signing financial statements 25
1.2.8. Addresses and deadlines for submitting financial statements 25
12.9. The procedure for making changes to the organization’s reporting 26
1.2.10. Publicity of financial statements 27
1.2.11. Audit of financial statements 29
1.3. Contents of financial reporting forms 30
1.3.1. Contents of the balance sheet 30
1.32. Contents of the income statement 39
1.3.3. Contents of the statement of changes in equity 49
1.3.4. Contents of the cash flow statement 51
1.3.5. Contents of the appendix to the balance sheet 53
1.4. Sequence of financial statement analysis 56
1.5. The impact of inflation on financial reporting data 59
1.5.1. Comparability of reporting data 59
1.5.2. Inflation and financial statements 60
Chapter 1 Quiz 71
2. METHODOLOGICAL BASIS OF FINANCIAL ANALYSIS 72
Chapter 2 Test Questions 86
3. ANALYSIS OF FORM No. 1 “BALANCE SHEET” 87
3.1. General assessment of the structure of the organization’s property and its sources according to balance sheet data 87
3.2. Results of a general assessment of the structure of assets and their sources as reported on the balance sheet 94
3.3. Balance sheet liquidity analysis 97
3.4. Calculation and assessment of financial solvency ratios 102
3.5. Criteria for assessing the insolvency (bankruptcy) of organizations 107
3.6. Determining the nature of the organization’s financial stability, calculating and assessing financial market stability ratios based on reporting data 125
3.6.1. Analysis of financial stability indicators 125
3.6.2. Analysis of the sufficiency of funding sources for the formation of reserves 128
3.7. Classification of the financial condition of an organization according to consolidated criteria for assessing the balance sheet 131
3.8. Analysis of indicators of intra-annual dynamics 137
3.9. General assessment of the organization's business activity. Calculation and analysis of the financial cycle 148
Chapter 3 Test Questions 160
4. ANALYSIS OF FORM No. 2 “PROFIT AND LOSS REPORT” 162
4.1. Analysis of the level and dynamics of financial results according to reporting data 162
4.2. Analysis of costs incurred by the organization 167
4.2.1. Main types and characteristics of classification of expenses of an organization 167
4.2.2. Cost analysis by element 170
4.3. Analysis of the influence of factors on profit 171
4.4. Profit dynamics analysis 175
4.5. Factor analysis of organization profitability 178
4.6. Consolidated system of organizational profitability indicators 182
4.7. Assessing the impact of financial leverage 189
4.7.1. The essence of financial leverage 189
4.7.2. The relationship between economic profitability and return on equity 191
4.7.3. Calculation of the financial leverage ratio 194
Chapter 4 Test Questions 197
5. ANALYSIS OF FORM No. 3 “REPORT ON CHANGES IN CAPITAL” 199
5.1. Sources of asset financing 199
5.2. Assessment of the composition and movement of equity capital 204
5.2.7. Analysis of the composition and movement of equity capital 204
52.2. Calculation and valuation of net assets 206
Test questions for Chapter 5 209
6. ANALYSIS OF FORM No. 4 “CASH FLOW REPORT” 211
6.1. Analysis of cash flows according to reporting data 211
Test questions for chapter 6 220
7. ANALYSIS OF FORM No. 5 “APPENDIX TO THE BALANCE SHEET” 222
7.1. Composition and assessment of the movement of borrowed funds 222
7.2. Analysis of receivables and payables 224
7.2.1. Accounts receivable analysis 224
7.2.2. Accounts payable analysis 230
7.3. Analysis of depreciable property 232
7.3.1. Analysis of intangible assets 232
7.32. Analysis of fixed assets 238
7.4. Analysis of the flow of funds for financing long-term investments and financial investments 247
7.4.1. The essence and differences between the concepts of investment and financial investments 247
7.4.2. Investment analysis problems 251
7.4.3. Main indicators of securities profitability analysis 252
7.5. Explanatory note to the annual financial report... 254
Chapter 7 Test Questions 257
8. DRAFTING A FORECAST BALANCE 259
Chapter 8 Test Questions 263
9. FEATURES OF PREPARATION AND ANALYSIS OF CONSOLIDATED REPORTING 264
9.1. The essence and basic concepts of consolidated reporting 264
9.2. Procedures and principles for the preparation and presentation of consolidated financial statements 276
9.3. Primary consolidation methods 281
9.4. Subsequent consolidation 286
9.5. Analysis of consolidated statements 288
Chapter 9 Test Questions 293
10. SPECIFICITY OF SEGMENTAL REPORTING OF THE ORGANIZATION 294
10.1. The essence and purpose of segmental reporting 294
10.2. Disclosure of information by reportable segments 297
10.3. Stages of creating segmental reporting for an organization 302
Test questions for chapter 10 304
APPLICATIONS 306
1. Balance sheet 306
2. Profit and loss statement 310
3. Statement of changes in equity 312
4. Cash flow statement 315
5. Appendix to the balance sheet 317
6. Report on the intended use of funds received 324
7. Dynamics of balance sheet indicators by quarter of the reporting year 326
8. Dynamics of indicators of the organization’s profit and loss statement in the reporting year 328
LITERATURE 330
Taking into account the variety of financial processes, the multiplicity of indicators of financial condition, differences in the level of critical assessments, the emerging degree of deviation from them of the actual values of the coefficients and the difficulties arising in connection with this in the overall assessment of the financial position of the organization, it is recommended to conduct a rating assessment of the financial condition.
The essence of this technique is to classify organizations according to the level of financial risk, that is, any analyzed organization can be assigned to a certain class depending on the number of points “scored”, based on its actual financial ratios.
- 1st Class- these are organizations with absolute financial stability and absolutely solvent, whose financial condition allows you to be confident in the timely fulfillment of obligations in accordance with contracts. These are organizations that have a rational structure of property and its sources, and, as a rule, are quite profitable.
- 2nd Class- these are organizations with normal financial condition. Their financial indicators as a whole are very close to optimal, but there is some lag in certain ratios. These organizations, as a rule, have a suboptimal ratio of their own and borrowed sources of financing, shifted in favor of borrowed capital. At the same time, there is a rapid increase in accounts payable compared to the increase in other borrowed sources, as well as compared to the increase in accounts receivable. These are usually profitable organizations.
- 3rd Class- these are organizations whose financial condition can be assessed as average. When analyzing the balance sheet, the weakness of certain financial indicators is revealed. Either their solvency is on the border of the maximum acceptable level, and their financial stability is normal, or, on the contrary, they have an unstable financial condition due to the predominance of borrowed sources of financing, but there is some current solvency. When dealing with such organizations, there is hardly a threat of loss of funds, but fulfilling obligations on time seems doubtful.
- 4th Class- These are organizations with an unstable financial condition. There is a certain financial risk when dealing with them. They have an unsatisfied capital structure, and their solvency is at the lower limit of acceptable values. Such organizations, as a rule, have no profit at all or very little, sufficient only for mandatory payments to the budget.
- 5th Class- these are organizations with a crisis financial condition. They are insolvent and completely unsustainable from a financial point of view. These enterprises are unprofitable...
Analysis of coefficients using the spectrum-point method
Russian specialists - R. S. Saifulin and A. D. Sheremet - proposed a methodology for a comprehensive comparative rating assessment of the financial condition and business activity of an enterprise.
The essence of this methodology is that when constructing the final rating assessment, data on the production potential of the enterprise, the profitability of its products, the efficiency of use of production and financial resources, the condition and allocation of funds, and their sources are used. The above system includes at least 20 indicators. With such a large number of indicators, many of them turn out to be closely related to each other (there are significant correlations between them). In addition, all indicators have some errors that are random.
This method involves analyzing financial ratios by comparing the obtained values with recommended standard values that play the role of threshold standards. The further the coefficient values are from the standard level, the lower the degree of financial well-being of the enterprise and the higher the risk of falling into the category of insolvent enterprises.
The selection of financial ratios is carried out with a focus on the following criteria:
1) availability of initial information and ease of calculation of estimated indicators;
2) elimination of duplicate coefficients, that is, coefficients related by an obvious linear relationship.
As a result, it is necessary to select the 16 most significant coefficients that give a comprehensive and complete picture of the financial and economic position of the enterprise. All coefficients are divided into 5 groups in accordance with the most significant characteristics of the financial and economic condition.
The indicators are calculated, their distribution by risk zones gives a primary idea of the financial position of the enterprise.
The next step is to reduce several indicators of each group to one resulting parameter K1.1, K1.2, K1.3 to K1, etc. Thus, each aspect of the enterprise’s activities is qualified by some general assessment. Based on these data, conclusions are drawn about the state of the enterprise.
Methodology L.V. Dontsova and N.A. Nikiforova
The essence of this technique is to classify enterprises by risk level, based on the actual level of indicators and the rating of each indicator in points. In the work of L.V. Dontsova and N.A. Nikiforova proposed a system of indicators and their rating assessment, expressed in points:
Class I - enterprises with a good margin of financial stability, allowing you to be confident in the repayment of borrowed funds;
Class II - enterprises that demonstrate some degree of debt risk, but are not yet considered risky;
Class III - problem enterprises. There is hardly any risk of loss of funds, but the full receipt of interest seems doubtful;
Class IV - enterprises with a high risk of bankruptcy even after taking measures for financial recovery. Lenders risk losing all their funds and interest;
Class V - enterprises of the highest risk, practically insolvent.
Methodology G.V. Savitskaya
Many domestic experts recommend using G.V.’s bankruptcy diagnostic technique. Savitskaya. The essence of this methodology is the classification of enterprises by risk level, based on the actual level of financial stability indicators and the rating of these indicators in points. To use this methodology, a model with three balance sheet indicators is used.
According to Savitskaya G.V., many different methods are used to assess the financial condition of an organization. Among them, we can highlight basic (logical) methods that are widely used in other disciplines for processing and studying information (comparisons, graphical, balance sheet, average and relative numbers, analytical groupings, heuristic methods for solving economic problems based on intuition, past experience, expert expert assessments, etc.).
Based on the results of the financial analysis, the organization’s activities as a whole are assessed, specific factors that have had a positive and negative impact on its results are identified, and options are developed for making optimal management decisions, both for the company’s management and for its business partners.