Sociometric technique, developed by J. Moreno, is used to diagnose interpersonal and intergroup relations in order to change, improve and improve them. With the help of sociometry, one can study the typology of social behavior of people in group activities, and judge the socio-psychological compatibility of members of specific groups.
A sociometric procedure may aim to:
a) degree measurement cohesion-disunity in Group;
b) identification of “sociometric positions”, i.e. the relative authority of group members according to characteristics likes and dislikes, where the “leader” of the group and the “rejected” are at the extreme poles;
c) detection of intragroup subsystems, cohesive formations, which may have their own informal leaders at their head.
The use of sociometry makes it possible to measure the authority of formal and informal leaders to regroup people in teams so as to reduce tension in the team that arises due to the mutual hostility of some group members. The sociometric technique is carried out using a group method; its implementation does not require much time (up to 15 minutes). It is very useful in applied research, especially in work to improve relationships in a team. But it is not a radical way to resolve intra-group problems, the causes of which should be sought not in the likes and dislikes of group members, but in deeper sources.
The reliability of the procedure depends primarily on the correct selection of sociometry criteria, which is dictated by the research program and preliminary acquaintance with the specifics of the group.
Sociometric procedure
The general scheme of actions for sociometric research is as follows. After setting the research objectives and selecting measurement objects, the main hypotheses and provisions regarding possible criteria for surveying group members are formulated. There cannot be complete anonymity here, otherwise sociometry will be ineffective. The experimenter’s requirement to reveal their likes and dislikes often causes internal difficulties among the respondents and manifests itself in some people in their reluctance to participate in the survey. When sociometric questions or criteria are selected, they are recorded on a special card or offered orally in an interview style. Each member of the group is obliged to answer them, choosing certain members of the group depending on their greater or lesser inclination, their preference over others, likes or, conversely, antipathies, trust or distrust, etc.
Group members are asked to answer questions that make it possible to discover their likes and dislikes one to one, towards leaders, group members whom the group does not accept. The researcher reads out two questions: a) and b) and gives the test subjects the following instructions: “Write on the pieces of paper under number 1 the name of the group member whom you would choose first, under number 2 who would you choose if there were no first, under the number 3 who would you choose if there were no first and second.” Then the researcher reads out a question about personal relationships and also gives instructions.
In order to confirm the reliability of the answers, the study can be conducted in a group several times. For repeated research, other questions are taken.
Sample questions for studying business relationships
1. a) which of your comrades from the group would you ask, if necessary, to provide help in preparing for classes (first, second, third)?
b) which of your comrades from the group would you like to ask, if necessary, to provide you with help in preparing for classes?
2. a) with whom would you go on a long business trip?
b) Which member of your group would you not take on a business trip?
3. a) which of the group members will better perform the functions of a leader (headman, trade union leader, etc.)?
b) which of the group members will find it difficult to fulfill the responsibilities of a leader?
Examples of questions for studied personal relationships
1. a) Who in your group would you turn to for advice in a difficult life situation?
b) with whom from the group would you like to consult about anything?
2. a) if all the members of your group lived in a dormitory, which of them would you like to live in the same room with?
b) if your entire group were reorganized, which of its members would you not want to keep in your group?
3. a) who from the group would you invite to your birthday?
b) who from the group would you not like to see at your birthday?
In this case, the sociometric procedure can be carried out in two forms. The first option is a nonparametric procedure. In this case, the subject is asked to answer the questions of the sociometric card without limiting the number of choices of the subject. If there are, say, 12 people in a group, then in this case each of the respondents can choose 11 people (except himself). Thus, the theoretically possible number of choices made by each group member towards other group members in the above example will be equal to (N-1), where N is the number of group members. In the same way, the theoretically possible number of choices received by a subject in a group will be equal to (N-1). Let us immediately understand that the indicated value (N-1) of the resulting elections is the main quantitative constant of sociometric measurements. In a nonparametric procedure, this theoretical constant is the same for both the individual making the choice and for any individual who is the object of the choice. The advantage of this version of the procedure is that it allows us to identify the so-called emotional expansiveness of each group member and to make a snapshot of the diversity of interpersonal connections in the group structure. However, when the group size increases to 12-16 people, these connections become so numerous that it becomes very difficult to analyze them without the use of computer technology.
Another disadvantage of the nonparametric procedure is the high probability of obtaining a random selection. Some subjects, guided by personal motives, often write in Questionnaires: “I choose everyone.” It is clear that such an answer can have only two explanations: either the subject really has developed such a generalized amorphous and undifferentiated system of relationships with others (which is unlikely), or the subject deliberately gives a false answer, hiding behind formal loyalty to others and to the experimenter (which is most likely) .
Analysis of such cases has led some researchers to try to change the very procedure for applying the Method and thus reduce the likelihood of random selection. This is how the second option was born: a parametric Procedure with a limited number of choices. The subjects are asked to choose a strictly fixed number from all members of the group. For example, in a group of 25 people, everyone is asked to choose only 4 or 5 people. The magnitude of the limitation on the number of sociometric elections is called the “sociometric limitation” or “election limit.” Many researchers believe that the introduction of a “sociometric constraint” significantly exceeds the reliability of sociometric data and facilitates statistical processing of the material. From a psychological point of view, sociometric limitation forces subjects to be more attentive to their answers, to choose to answer only those group members who really correspond to the proposed roles of partner, leader or comrade in joint activities. The election limit significantly reduces the likelihood of random responses and makes it possible to standardize election conditions in groups of different sizes in one sample, which makes it possible to compare material across different groups.
Currently, it is generally accepted that for groups of 22-25 participants, the minimum value of the “sociometric constraint” should be chosen within 4-5 choices. A significant difference in the second version of the sociometric procedure is that the sociometric constant (N-1) is preserved only for the system of resulting elections (i.e., from group to participant). For a system of given choices (i.e., to a group from a participant), it is measured by a new value d (sociometric constraint). By introducing this value, it is possible to standardize the external conditions of elections in groups of different sizes. To do this, it is necessary to determine the value of d using the same probability of random selection for all groups. The formula for determining such a probability was proposed at one time by J. Moreno and E. Jennings: P(A)=d/(N-1), where P probability of a random event (A) of sociometric choice; N number of group members.
Typically, the value of P(A) is selected within the range of 0.20-0.30. Substituting these values into formula (1) to determine d with a known value N, we obtain the desired number of “sociometric restrictions” in the group chosen for measurements.
The disadvantage of the parametric procedure is the inability to reveal the diversity of relationships in a group. It is possible to identify only the most subjectively significant connections. As a result of this approach, the sociometric structure of the group will reflect only the most typical, “selected” communications. The introduction of a “sociometric limitation” does not allow us to judge the emotional expansiveness of group members.
A sociometric card or sociometric questionnaire is compiled at the final stage of program development. In it, each group member must indicate his attitude towards other group members according to selected criteria (for example, in terms of teamwork, participation in solving a business problem, leisure time, playing, etc.) The criteria are determined depending on the program of this study : whether relationships are studied in an industrial group, a leisure group, a temporary group or a stable group.
Sociometric card
When conducting a survey without limiting the choices, the sociometric card should have a column after each criterion, the size of which would allow one to give fairly complete answers. In a survey with limited elections, to the right of each criterion, as many vertical graphs are drawn on the card as the number of elections we expect to allow in this group. Determining the number of elections for groups of different sizes, but with a predetermined value of P(A) in the range of 0.14-0.25, can be done using a special table (see below).
Limitation values of sociometric choices
Sociometry results. Data processing
When the sociometric cards are filled out and collected, the stage of their mathematical processing begins. The simplest methods of quantitative processing are tabular, graphical and indexological.
Sociomatrix (table). First, you should build a simple sociomatrix. An example is given in the table (see below). The election results are distributed throughout the matrix using symbols. The results tables are filled out first, separately for business and personal relationships.
The surnames of all members of the group being studied are written down vertically behind the numbers; horizontally only their number. At the corresponding intersections, the numbers +1, +2, +3 indicate those whom each subject chose in the first, second, third place, and the numbers -1, -2, -3 those whom the subject does not choose in the first, second and third place. .
Mutual positive or negative choices are circled in the table (regardless of the order of choice). After the positive and negative elections are entered into the table, it is necessary to calculate vertically the algebraic sum of all elections received by each member of the group (sum of elections). Then you need to calculate the sum of points for each member of the group, taking into account that the choice in the first place is equal to +3 points (-3), in the second - +2 (-2), in the third - +1 (-1). After this, the total algebraic sum is calculated, which determines the status in the group.
| № | Surname | 1 | 2 | 3 | 4 | 5 | 6 | 7 | 8 | 9 | 10 |
| 1 | Ivanov | +1 | +2 | +3 | -1 | ||||||
| 2 | Petrov | +1 | +3 | +2 | |||||||
| 3 | Sidorov | -1 | +1 | +2 | +3 | ||||||
| 4 | Danilova | +2 | +1 | +3 | |||||||
| 5 | Alexandrova | +2 | +1 | +3 | -3 | -2 | |||||
| 6 | Adamenko | ||||||||||
| 7 | Petrenko | +1 | +3 | ||||||||
| 8 | Kozachenko | +1 | +3 | +2 | |||||||
| 9 | Yakovleva | +2 | +1 | +3 | -1 | ||||||
| 10 | Shumskaya | +2 | +1 | +3 | -1 | ||||||
| Number of elections | |||||||||||
| Number of points | |||||||||||
| total amount |
Note: + positive choice; - negative choice.
Analysis of the sociomatrix for each criterion gives a fairly clear picture of the relationships in the group. Summary sociomatrices can be constructed that give a picture of elections based on several criteria, as well as sociomatrices based on data from intergroup elections. The main advantage of the sociomatrix is the ability to present elections in numerical form, which in turn allows you to rank group members according to the number of elections received and given, and to establish the order of influences in the group. Based on the sociomatrix, a sociogram map of sociometric elections (sociometric map) is constructed.
Sociogram
Sociogram graphical representation of the reaction of subjects to each other when answering a sociometric criterion. A sociogram allows you to make a comparative analysis of the structure of relationships in a group in space on a certain plane (“shield”) using special signs (Fig. below). It gives a clear idea of the intra-group differentiation of group members based on their status (popularity). An example of a sociogram (map of group differentiation) proposed by Y. Kolominsky, see below:
> positive one-sided choice,
<>positive mutual choice,
------> negative unilateral choice,
<------>negative mutual choice.
The sociogram technique is a significant addition to the tabular approach in the analysis of sociometric material, because it allows for a deeper qualitative description and visual representation of group phenomena.
Sociogram analysis consists of finding the central, most influential members, then mutual pairs and groupings. Groups are made up of interconnected individuals who seek to choose each other. Most often in sociometric measurements there are positive groups of 2, 3 members, less often of 4 or more members.
Sociometric indices
There are personal sociometric indices (PSI) and group sociometric indices (GSI). The first characterize the individual socio-psychological properties of a person in the role of a group member. The latter provide numerical characteristics of the holistic sociometric configuration of choices in the group. They describe the properties of group communication structures. The main P.S.I. are: index of sociometric status of the i-member; emotional expansiveness of the j-member, volume, intensity and concentration of interaction of the ij-member. The characters i and j represent the same person, but in different roles; i chosen, j also chooser, ij combination of roles.
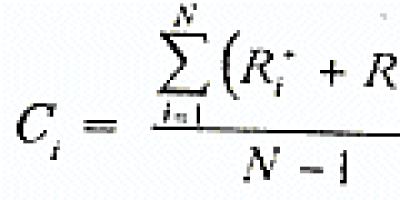
The I-member of the group is determined by the formula:

where C i sociometric status of the i-member, R + and R - the elections received by the i-member, Z the sign of the algebraic summation of the number of received elections of the i-member, N the number of group members.
Sociometric status is the property of a person as an element of a sociometric structure to occupy a certain spatial position (locus) in it, that is, to relate in a certain way to other elements. This property is developed unevenly among the elements of the group structure and for comparative purposes can be measured by the number index of sociometric status.
Elements of sociometric structure are individuals, members of a group. Each of them, to one degree or another, interacts with each other, communicates, directly exchanges information, etc. At the same time, each member of the group, being part of the whole (group), influences the properties of the whole with their behavior. The implementation of this influence occurs through various socio-psychological forms of mutual influence. The subjective measure of this influence is emphasized by the magnitude of sociometric status. But a person can influence others in two ways - either positively or negatively. Therefore, it is customary to talk about positive and negative status. Status also measures a person's potential leadership ability. To calculate sociometric status, you need to use sociomatrix data.
It is also possible to calculate C-positive and C-negative status in small groups (N).
The J-group member is calculated using the formula

where Ej emotional expansiveness of the j-member, R j choices made by the member (+, -). From a psychological point of view, the indicator of expansiveness characterizes the individual’s need for communication.
From G.S.I. the most important are: Index emotional expansiveness of the group and the index of psychological reciprocity.
Group Emotional Expansiveness Index calculated by the formula:

where Ag group expansiveness, N number of group members? R j (+,-) choices made by the j-member. The index shows the average activity of the group when solving a sociometric test task (per each group member).
Psychological Reciprocity Index (“group cohesion”) in a group is calculated using the formula
:
where Gg reciprocity in the group based on the results of positive elections, A ij + the number of positive mutual connections in the group N the number of group members.
Literature:
1. Methods of psychological diagnostics. - M., 1993
2. Methods of socio-psychological diagnostics of individuals and groups. - M., 1990
The topic of interpersonal relationships has been and will always be relevant. After all, social life is impossible without a clash of opinions, intersection of ideas and simply a divergence of personal interests. Any group of people is a living organism, with its own temperature, pressure and allergic reactions. These health indicators extend from the elementary grades of a regular high school to the board of directors of a leading oil company.
What it is?
Sociometry is an effective method for measuring mutual likes and dislikes in a team. This technique of J. Moreno, a popular American psychologist and psychiatrist, allows you to solve the following problems:
- measure the level of group cohesion;
- determine the level of authority of both the leader and other group members;
- discover leaders, outcasts, and informal in-group cohesions.
This socio-psychological test is popular in both American and European companies. Not so long ago, domestic managers also appreciated its effectiveness. The basis of the methodology is to fill out a questionnaire that reflects the following factors in relationships with other group members:
- professional recognition;
- personal trust;
- emotional intimacy.
Case study
Interviewees must indicate from 3 to 5 names of people from their group for each item. Questions are usually composed in any form depending on the characteristics of the group. Examples of questions:
Surnames are written using numbering:
1) Ivanov; 2) Petrov; 3) Sidorov. This technique allows you to see the overall picture of sympathies in the group and arrange the level of preferences in order.
Based on these results, the sociometric status of each group member is determined and a rating of employees is compiled for each factor: professional recognition, personal trust; emotional intimacy. The information obtained allows you to see the “stars” and “outsiders” in the main areas of relationships in the team.
The socio-psychological test is recommended for use in teams of 10 people or more. This technique helps to see not only the shadow side of relationships in the team, but also the gaps in the work of the manager. Therefore, it becomes possible to develop an action plan to improve the situation.
Problem 1. Weak connection with employee No. 8 (did not choose his manager based on any factor).
Recommendation. Pay more attention to the work of this employee, establish an emotional connection.
Problem 2. Three “outsiders” in the team (none of their colleagues chose them based on any factor).
Recommendation. Organize work projects and additional assignments by bringing together “outsiders” and “stars.”
Problem 3. Low rate of mutual choices in the area of the emotional factor in the entire group.
Sociometry is considered a successful tool that determines the level of satisfaction with one's position in a group for each of its members. It is no coincidence that J. Moreno called this method this way. After all, the temperature of the climate of relationships in a group is determined, according to the author of the methodology, not only by the general characteristics of the group, but also by the internal state of each person.
The socio-psychological test developed by J. Moreno (has many modifications) is used to assess interpersonal emotional connections in a group, i.e. mutual sympathy between group members, and to solve the following problems:
a) measuring the degree of cohesion-disunity in the group;
c) detection of intra-group cohesive formations led by informal leaders.
Any group of people of any age, starting from preschool, who have some experience of interaction and communication, can be examined. Depending on the tasks that the study is designed to solve, and on the characteristics (age and professional) of the groups being studied, criteria for sociometric choice are formed. A criterion is an activity for which an individual must select or reject one or more group members. It is formulated in the form of a specific sociometric test question. The content of the criteria can be formal or informal. With the help of the former, relationships regarding the joint activity for which the group was created are measured. The latter serve to measure emotional and personal relationships not related to joint activities (for example, choosing friends for leisure). Depending on the orientation, the criteria are divided into positive (“Who would you like to work with?”) and negative (“Who would you not want to work with?”). After selecting and formulating the criteria, you also compile a questionnaire containing instructions and a list of criteria.
Before the start of the survey, the test group is briefed (sociometric warm-up). During it, you should explain to the group the purpose of the study, emphasize the importance of its results for the group, show how to complete the tasks, and ensure that the answers are kept secret.
Example text of instructions. “When forming your group, naturally, your wishes could not be taken into account, since you were not sufficiently familiar with each other. Now the relationships in the group have been sufficiently defined, and it is beneficial for both you and your management to take your wishes into account when organizing the activities of your team. Try to be sincere in your answers. The researchers guarantee the secrecy of individual responses.”
It is necessary to try to establish an atmosphere of trust in relations with the group. Lack of trust in the experimenter and suspicions that the survey results can be used to harm the subject lead to a refusal to complete the task as a whole or to a refusal to make a negative choice. After this, we proceed directly to the survey. All members of the group are subject to it. Respondents must write down the names of the group members they selected based on one or another criterion on the questionnaire and indicate their last name. During the survey, the researcher must ensure that the respondents do not communicate with each other, constantly emphasize and remind them of the obligation to answer all questions. There is no need to rush into asking subjects to give answers. At the same time, if subjects do not have a list of group members, visual contact should not be prevented. It is advisable to write the names of those absent on the board.
There are three main selection methods:
1) The number of elections is limited to 3 - 5;
2) complete freedom of choice is allowed (everyone can write down as many decisions as they wish);
3) the subject ranks all group members depending on the proposed criterion.
From the point of view of simplicity and convenience of processing the results, the first method is preferable. From the point of view of the reliability and validity of the results obtained, it is the third. In addition, the ranking method manages to remove the fear of a negative choice. Below is an example of a group survey using the first selection method, that is, each respondent has the right to select only three people. The questions are written in a direct form according to a positive criterion.
Sample
Data processing and interpretation of results
Based on the results obtained, a matrix is compiled (Table 1). The matrix consists of: vertically – a list of group surnames, arranged in alphabetical order and grouped by gender; horizontally – their numbers, under which the subjects are indicated in the list.
Table 1 (selection criterion: 1)
Matrix of sociometric positive choices
| Full Name | |||||||||||
| Alexandrov Pasha | |||||||||||
| Ivanov Sergey | |||||||||||
| Petrov Dima | |||||||||||
| Sarchenko Sergey | |||||||||||
| Alferova Ira | |||||||||||
| Volodina Galya | |||||||||||
| Ladzina Natasha | |||||||||||
| Lovshina Nina | |||||||||||
| Pokrovskaya Alla | |||||||||||
| Samoilova Tanya | |||||||||||
| Number of elections (M) | |||||||||||
| Number of mutual elections | |||||||||||
Opposite the surname of each subject, data on the choices he made is entered. For example, if P. Aleksandrov gave his first choice in the experiment according to the first criterion to S. Ivanov, then the number 1 is placed at the intersection of the first row and the second column. Alexandrov gave the second choice to D. Petrov, so the number 2 is written in a square at the intersection of the first line and the third column. If the subjects made mutual choices, then the corresponding numbers of these choices are circled (in our table they are highlighted in dark color). At the bottom of the matrix, the number of choices received by each subject is counted (vertically from top to bottom), including mutual choices.
where C is the sociometric status of the student; M is the total number of positive choices received by subjects (if negative choices are taken into account, then their sum is subtracted from the sum of positive ones); n – number of subjects.
For example, the sociometric status of Ivanov S. will be equal to 4: 9 = 0.44
Depending on the number of sociometric positive choices received, subjects can be classified into five status groups (see Table 2).
table 2
Classification of subjects based on the results of a sociometric experiment
| Status group | Number of selections received |
| "Stars" | Twice the average number of choices received by one subject |
| "Preferred" | One and a half times more than the average number of choices received by one subject |
| "Accepted" | |
| "Unaccepted" | One and a half less than the average number of choices received by one subject |
| "Rejected" | Equal to zero or half the number of choices received by one subject |
The average number of choices received by one subject (K) is calculated by the formula:
K=_ The total number of selections made.
Total number of subjects
For our example, K = 30: 10 = 3.
In accordance with the matrix data, subjects can be classified into the following groups:
“Stars” - Volodina G.;
“Preferred” – Ladzina N.;
“Accepted” – Ivanov S., Petrov D., Sarchenko S., Alferova I., Levshina N., Pokrovskaya A.;
“Unaccepted” – no;
“Rejected” – Alexandrov P., Samoilova T.
One of the indicators of the well-being of emerging relationships is the coefficient of reciprocity of elections. It shows how mutual sympathies are in the community. The reciprocity coefficient (KB) is calculated using the formula:
Number of mutual elections
KB = Total number of selections
In our case, KB = (20: 30) x 100% = 66.7%. This indicator indicates a fairly large number of mutual elections.
A sociogram is constructed based on the completed sociometric matrix. It allows you to visualize the results and clearly see the picture of the existing relationships in the group. You can build individual and group sociograms. In practice, individual sociograms are rarely used (it only makes sense to construct one to compare leaders of different groups of the same level), since a group sociogram completely reflects the entire picture of group relationships.
The most common type of sociogram is the “target”. It is a set of concentric circles, the number of which corresponds to the largest number of choices for one member of the group.
Long-term practice of using the sociometric method allows us to assert that constructing a sociogram of the “target” type does not cause any particular difficulties (even in a group of 15 people, the maximum number of choices rarely exceeds 10). If the group consists of 15–20 people, then to construct it you need to use a sheet of whatman paper of a suitable format - A3 (420x297), since there will be many lines on the sociogram. It is advisable to display men and women using different icons (for example, a square and a circle). Inside such an icon, the number of the participant is indicated, corresponding to its serial number in the matrix. It is recommended to plot data on a sociogram in the order in which they are recorded in the matrix, and not depending on the number of choices received (in this case, there is less chance of error).
Group member selections are shown with red arrows, deviations with blue arrows. Options for mutual selections and rejections are possible; such cases are displayed with double-sided arrows. To make them stand out against the general background, it is advisable to use thicker lines.
SOCIOMETRY
Sociometry is a method that allows you to express quantitatively and graphically the structure of interpersonal relationships in a team.
Sociogram - graphical representation of respondents' attitudes towards each other.
The sociometry method helps to obtain a “photograph” of intra-collective relationships between schoolchildren. The importance of the role of each student in the team, his sympathies, trust, goodwill influence their actions, behavior, the formation of their beliefs, moral habits and other qualities.
Sociometric studies can be carried out using graphical drawings. Children are offered a square card - this is a class. The circle in the square is the guys from his class. Invite the child to indicate his place among the children (in the form of a dot). If a child puts a dot in the center, he feels comfortable in a team (this is a leader). If he is on the border of the circle or outside it, help is needed (he is isolated, an outcast, it is difficult for him).
Remember! Sociometry can detect discrepancies between the official and unofficial structures of a team, sources of tension and conflict - this facilitates the formulation of tasks for collective and individual educational work. The results of this technique require serious qualitative analysis. It is not recommended for a teacher to use this technique if for some reason his relationship with the class team or individual children is damaged.
When using the sociometry method, it should be remembered that it imposes great responsibility on the teacher and requires from him a high sense of tact and proportion. A lot of conflicts between teachers and children arise due to unfair, in the opinion of students, assignment of points. Children sometimes feel, and I must admit, not unreasonably, that their teachers’ assignments were unfair. This problem can be solved by presenting children with evaluation criteria and systematically teaching them to evaluate the answers of their peers and their own using these criteria. Let us give as an example one of the possible options for assessment criteria for any subject.
EXAMPLE:
Criteria for assessing student performance
Ratings:
- It's a pity, of course, but your answers are wrong.
Ratings 4-5. Too many mistakes were made in the answers.
Score 6-7. Correct answers to all questions, but two or three mistakes were made.
Score 8. Much better already. Correct answers to all questions and only one mistake.
Score 9. Well done. All answers are correct, not a single mistake.
Score 10. This is great! All the answers are correct, not a single mistake, tasks completed correctly that the teacher did not even ask to do.
When planning classes at the School of Assets, it is necessary to carry out diagnostics. Diagnostics is an assessment procedure aimed at clarifying the situation, identifying the true level of education, activity, implementation of tasks, and finding out which of them require further solutions.
Experience shows that diagnostics has a direct connection with the stages of management, team and individual development (application). Three main diagnostic options have been identified:
- When the team is formed for the first time.
- When the team is not new, but the teacher starts work for the first time.
- When the teacher and the team worked together.
SOCIOMETRY
Target: to study the state of emotional and psychological relationships in the teenage community and the position of each of the children in them.
Necessary for carrying outfollowing. Every teenager should have a form with the following text: “Please answer the following questions:
- If you had the opportunity to invite any of the students in your group to your birthday party, who would you invite? (Here and for the next three questions, indicate the last name and first name of this person.)
- Who would you invite to your birthday last?
- Who will you trust your secret to?
- Who will you never trust with your secret? Thank you!"
Progress of the survey
The researcher asks four questions in turn, which are the selection criteria (two positive and two negative choices). Each of the subjects, answering them, writes down on the form below the proposed question the names of three people to whom he gives his choices. In this case, the first to be indicated is the one to whom the subject gives his greatest sympathies (antipathies in the case of negative criteria-questions), then the names of those who are given preference in the second and third place are written down. When answering different questions, the names of the selected students
may be repeated (the subjects should be told about this). After completing the task, the researcher and subjects must check whether the names of three people are named after each question. Correct completion of the task makes it easier to process the experiment results.
PROCESSING AND INTERPRETATION OF OBTAINED DATA
Based on the results obtained, a matrix is compiled.
The matrix consists of: vertically - a list of students' names, arranged in alphabetical order and grouped by gender; horizontally - from the number under which the subjects are indicated in the list.
Opposite the surname of each subject, data on the choices he made is entered. For example, if P. Aleksandrov gave his first choice in the experiment according to the first criterion to A. Ivanov, then the number 1 is placed at the intersection of the first row and the second column. Aleksandrov gave the second choice to A. Begliev, so the number 2 is written in a square at the intersection of the first and third columns. If the subjects made mutual choices, then the corresponding numbers of these choices are circled. At the bottom of the matrix, the number of choices received by each subject is counted (vertically from top to bottom), including mutual choices. In the same way, the matrix of negative sociometric choices.
C=M / (n-1),
where C is the sociometric status of the teenager;
M is the total number of positive choices received by subjects (if negative choices are taken into account, then their sum is subtracted from the sum of positive ones);
n - number of subjects;
For example: sociometric status of Ivanov A. Will be equal to the quotient obtained from division: 7: 9 = 0.78.
Depending on the number of sociometric positive choices received, subjects can be classified into five status groups.
Surname, Name | Choice | Who do they choose? 1 2 3 4 5 6 7 8 9 10 |
|
Alexandrov Peter Ivanov Alexey Begliev Anvar Ilchenko Ivan Kislova Maria Kitaeva Anna Malakhova Sima Novikova Elena Pavlova Elena Pokrovskaya Daria | 1 2 3 2 1 3 1 2 3 1 2 3 2 3 1 2 3 1 2 1 3 1 2 3 1 3 2 1 2 3 3 2 1 2 3 1 1 2 3 1 3 2 1 3 2 2 1 3 2 1 3 2 1 3 1 2 3 |
||
Elections received Received mutual elections | 0 7 6 5 6 12 10 5 8 1 0 5 4 4 6 6 6 3 6 0 |
Classification of subjects
Based on the results of the sociometric experiment
The average number of choices by one subject (K) is calculated by the formula:
K = Total number of positive choices made
Total number of subjects
For our example K = 60: 10 = 6
In accordance with the matrix data, subjects can be classified into the following groups:
"Stars" - Kitaev A.;
"Preferred" - Malakhova S.;
“Accepted” - Ivanov A., Begliev A., Ilchenko I., Kislova M., Novikova E.;
"Not accepted" no;
"Rejected" Alexandrov P., Pokrovskaya D.
One of the indicators of the well-being of emerging relationships is the coefficient of reciprocity of elections. It shows how mutual sympathies are in the children's community. The reciprocity coefficient (CR) is calculated using the formula:
KV = Number of mutual elections
Total number of elections
In our case, CV = (40: 60).100% = 66.7% This indicator indicates a fairly large number of mutual elections.
OUR RELATIONS
(methodology based on the book: L.M. Friedman “Studying the personality of the student and student groups”)
Target: to identify the degree of satisfaction of a teenager with various aspects of the life of the team.
Progress of the survey
The subject is asked to read six statements. You need to write down the number of the statement that most closely matches his opinion. Several different areas of relationships among adolescents in a team can be identified. For example, to study mutual acceptance of each other (friendship, cohesion) or, conversely, conflict, a series of statements can be proposed:
- 1. Our team is very friendly and united.
- 2. Our team is friendly.
- 3. There are no quarrels in our team, but everyone exists on their own.
- 4. There are sometimes quarrels in our team, but our team cannot be called conflict-ridden.
- 5. Our team is not friendly, quarrels often arise.
- 6. Our team is very unfriendly. It is difficult to study in such a class.
Another series of statements reveals the state of mutual assistance (or lack thereof):
- 1. In our group it is customary to help without a reminder.
- 2. In our group, help is provided only to our friends.
- 3. In our group, they help only when the student himself asks for it.
- 4. In our group, help is provided only when the teacher requires it.
- 5. In our group it is not customary to help each other.
- 6. In our group they refuse to help each other.
Processing and interpretation of results
Those judgments noted by the majority of students indicate certain relationships in the team. At the same time, the opinion of a particular teenager shows how he feels in the system of these relationships.
Teacher - psychologist Molokanova V.N.
PSYCHOLOGICAL ATMOSPHERE IN THE TEAM
(method by L.G. Zhedunova)
Target: study the psychological atmosphere in the team.
Progress of the survey
Each teacher and teenager is asked to evaluate the state of the psychological atmosphere in the team using a nine-point system. Polar qualities are assessed:
9 8 7 6 5 4 3 2 1
1. Friendliness Hostility
2. Agreement Disagreement
3. Satisfaction Dissatisfaction
4. Passion Indifference
5. Effectiveness Ineffectiveness
6. Warmth of relationships Coldness of relationships
7. Cooperation Lack of cooperation
8. Mutual support Malevolence
9. Entertaining Boredom
10. Success Failure
The higher the score, the higher the assessment of the psychological climate, and vice versa.Analysis of resultsinvolves subjective assessments of the state of the psychological climate and their comparison with each other, as well as the calculation of the average assessment of the atmosphere for the team.
QUESTIONNAIRE FOR STUDENTS
Target: determine the state of interaction between teachers and students in the team, as well as the dynamics of its development.
Progress of the survey
Respondents are asked to answer the following questions:
- Which adults should be invited on a camping trip?
- Who is your moral example? *
a) comrades;
b) parents;
c) teachers;
d) book heroes;
e) outstanding athletes;
f) participants of youth ensembles;
g) no one;
h) add ____________________________________
- In what areas of life do students at your educational institution have real rights:
a) in improving the educational process;
b) in organizing leisure time;
c) in monitoring the quality of knowledge;
d) in encouragement;
e) in the organization of educational work;
e) nowhere;
g) add
- where you can most fully express your personality (where you are most interested, where you are valued and understood);
a) in educational work;
b) in classes in clubs;
c) in the company of friends;
d) in social work;
e) in educational and labor training;
f) in leisure activities;
g) in the family
h) nowhere;
i) add _______________________________________
- Who can you be frank with:
a) with no one;
b) with the guys from our company;
c) with the director of the educational institution;
d) with group mates;
e) with parents;
f) with the head of the circle, section, club;
g) with grandparents;
h) with the class teacher;
i) with an old acquaintance;
j) with any person;
k) with a teacher;
m) add _____________________________________
- What would you do if the teacher, in your opinion, unfairly offended you:
a) I will remain silent;
b) I will respond with insolence;
c) I will turn to my parents for support;
d) I will turn to my comrades for support;
e) I will calmly try to prove that I am right;
e) I will complain to the administration;
g) if necessary, I will take revenge;
h) I will contact the class teacher;
i) I will turn to a teacher I trust;
j) I will ask you to raise my question at a class meeting;
k) add ______________________________________
- In what activities do teachers of an educational institution participate “on equal terms” with students?
__________________________________________________________________________________________________________________________________________________________________
- Complete the phrases: “I want to go to school when_____________________________________________
"I don't want to go to school when____________
_____________________________________________________
"The model of moral attitude towards people in our educational institution is _________________________________
______________________________________________________
"The relationship between teachers and students in our educational institution can be called _____________________________________________
______________________________________________________
- What systems of relations in the lyceum need to be improved:
a) teacher - student;
b) teachers - teachers;
c) teachers - administration;
d) teachers - parents;
e) parents - students;
f) students - students;
g) administration - students
- Who can you turn to for help in difficult times?
- What matters in the educational institution, in your opinion, can be resolved:
a) teachers alone;
b) jointly between teachers and students;
c) by independent students
- In the team of employees of our educational institution, the following relationships prevail:
a) hostile;
b) unfriendly;
c) business;
d) group;
e) you - to me, I - to you;
g) all kinds;
h) friendly;
i) add __________________________________________
Teacher-psychologist Molokanova V.N.
DETERMINING THE LEVEL OF DEVELOPMENT
SELF-GOVERNMENT IN THE COLLECTION
(method of M. I. Rozhkov)
Target: determine the level of development of student self-government.
Progress of the survey
Each teenager fills out a form with the following numerical codes and sentences.
4 3 2 1 0 1. I consider it important for myself to strive for the staff of my group to work better.
4 3 2 1 0 2. I make suggestions for improving the work of the group.
4 3 2 1 0 3. I independently organize individual events in the group.
4 3 2 1 0 4. I participate in the results of the group’s work and in determining the immediate tasks.
4 3 2 1 0 5. I believe that the group is capable of independent independent actions.
4 3 2 1 0 6. In our group, all responsibilities are clearly and evenly distributed among the guys.
4 3 2 1 0 7. The elected activist in the group does not enjoy authority among all members of the team.
4 3 2 1 0 8. I believe that the asset in our group copes with their responsibilities well and independently
4 3 2 1 0 9. I believe that the children in our class are conscientious in fulfilling their social duties.
4 3 2 1 0 10. I timely and accurately implement decisions made by the meeting or group members.
4 3 2 1 0 11. I strive to make every effort to ensure that the tasks assigned to the team are completed.
4 3 2 1 0 12. Ready to answer for the results of my work and for the results of the work of my comrades.
4 3 2 1 0 13. We have a good idea of the tasks facing the staff of the educational institution.
4 3 2 1 0 14. Students in my group often participate in organizing various events for the entire lyceum team.
4 3 2 1 0 15. We strive to help representatives of the group staff and self-government bodies of the lyceum in solving the problems facing them.
4 3 2 1 0 16. My comrades and I regularly participate in discussions of problems facing the lyceum staff.
4 3 2 1 0 17. We strive to collaborate in solving problems
standing in front of the entire team, with other groups and associations.
4 3 2 1 0 18. I am satisfied with the attitude of my comrades towards other groups.
4 3 2 1 0 19. We strive to help other teams, junior groups in resolving difficulties that arise before them.
4 3 2 1 0 20. I believe that students elected to the self-government bodies of an educational institution enjoy well-deserved authority
4 3 2 1 0 21. Students in my group conscientiously carry out the instructions of the student government bodies of the entire team.
4 3 2 1 0 22. We strive to ensure that the staff of the educational institution achieves better results.
4 3 2 1 0 23. Ready to defend the interests of the entire lyceum staff in other groups and public organizations.
4 3 2 1 0 24. I am aware of my responsibility for the results of the work of the entire lyceum team.
The board gives the semantic meaning of the digital codes:
4 - "Yes"; 3 - “Rather yes than no”; 2 - "It's hard to say"; 1 - “Rather no than yes”; 0 - "No".
Processing the results
When processing the results, 24 sentences are divided into 6 groups (blocks). This systematization is due to the identification of variousaspects of self-government:
- the involvement of adolescents in self-government activities (proposals 1 - 4);
- organization of the class team (5 - 8);
- responsibility of members of the primary team for its affairs
(9 - 12);
- involvement of the group in the affairs of the entire team (13 - 16);
- relationships of the group with other learning communities
(17 - 20);
- responsibility of students for the affairs of the entire staff of the educational institution (21 - 24).
For each block, the sum of points awarded is calculated.
All survey participants. Then it is divided by the number of survey participants and sixteen (16 is the maximum number of points that a respondent can indicate in each block). The level of self-government of a team or association is determined by the results of isolating the coefficients of three blocks. If at least one of the coefficients is less than 0.5, then the level of self-government short ; if more than 0.5 and less than 0.8 - average ; if more than 0.8 - high.
The level of development of self-government of the entire educational institution is determined by the coefficient of the last three blocks. If each of them does not exceed 0.55, then the level of self-government in the team short, if above this level, but below 0.85 - the level of development of self-government
Often people, for work, study or just communication, are placed in conditions of existence within the framework certain groups. Their relationships among themselves create a certain psychological and social structure, the indicators of which determine the characteristics of the group, the degree of freedom of behavior of each person, his state of mind and reveals the compatibility of individual individuals.
Social psychologist J. Moreno, a famous psychiatrist in America, laid the foundation method of sociometric technique to diagnose and study relationships between individuals and existing groups in order to improve and improve the moral climate in the team.
Sociometry tasks
The sociometry test is designed to study the emotional relationships between individuals. individuals in the team and solutions to the following issues:
- determining the degree of disunity or cohesion between members of the selected group;
- identification of authoritarianism of individual team members, taking into account signs of antipathy or sympathy, determination in a group stars, leaders And rejected, which can be killed by all other participants;
- detection of cohesive subgroups headed by informal leaders.
 The method allows you to study and analyze the dynamics of relationships in a group in order to use the obtained data for perestroika team, increasing the efficiency of the common cause, uniting the existing group. Moreno sociometry is carried out in a group manner, the procedure requires little time and is a useful procedure for improving relationships between individual members.
Sociometric research cannot be given great importance for the purpose of instantly resolving psychological problems that have arisen, the sources of which are not the antipathies and sympathies of team members, but independent deep problems.
Currently, the method of sociometry developed by J. Moreno has undergone a number of changes and it has branches modifications. Famous psychologists Ya. L. Kolominsky, I. P. Volkova, E. S. Kuzmina, V. A. Yadova actively worked on its implementation in the research of Soviet scientists.
Conducting a sociometric test
Preparatory work
 For study, a group of people of different ages is selected, consisting of members of children's, school and adult groups, within which certain psychological communication and social interaction are observed. Criteria for sociometric choice, as a result of which an individual determines leader or victim, are determined depending on the age of the group members and the tasks set at the beginning of the study.
 The results are determined after conducting the survey in the form sociometric test. The criteria can be in the form of informal or formal content. Formal research aims to identify interpersonal relationships within the overall activities of the group for which it was created. Informal content reveals emotional connections that arise for leisure activities, but do not affect the main joint work.
Before starting a sociometric survey, the instructor explains the purpose of studying relationships, emphasizing the importance truthfulness the data obtained, shows an example of the work being done, and guarantees the secrecy of the expression of sympathy or antipathy towards other members of society. For the most complete selection of criteria for conducting a survey, the program dictates mandatory preliminary familiarization with the specific features of group activity.
The standard survey scheme is as follows:
- the main provisions and hypotheses of the survey of individual participants are formed after identifying research tasks and selecting an object group for study;
- complete anonymity is considered as a criterion that drags research down the path of low efficiency;
- the instructor’s requirement to publicly demonstrate their likes and dislikes often leads to difficulties with answers and the reluctance of some participants to continue the sociometric survey;
- the selected criteria and questions are recorded on the card, and options for oral responses in the form of interviews have also been developed;
- The person participating in sociometry is obliged to answer questions, choosing those whom he could consider a leader or starve the outcast with inappropriate behavior.
Sample questions
Members of the team being studied answer questions that reveal their antipathies And sympathy to each other or to formal or informal leaders:

Questions about personal relationships in the group are asked in the same order. If there are doubts about the correctness of the answers, or the study does not reveal sociometric data, then the survey is carried out in a group several times until reliable information is obtained, and other questions are asked, for example:

Forms of sociometry
The procedure is carried out in two types:
- non-parametric form;
- parametric form.
Non-parametric survey type
 In this case, the number of selected candidates to answer the question is not limited. For example, if the number of group members is 10, then the survey participant can choose 9 people, excluding only himself. Thus, the number of theoretically selected candidates when answering will be equal to the number of team members minus one. The number of elections made by one member of the group will also be equal to this number. In the process of the nonparametric option, this constant becomes the same for the participant answering within the framework of sociometry and any member of the group who was the object of choice.
 Dignity This type of survey is that the emotional characteristics of each group member are relatively reliably revealed and the structure of interpersonal relationships is determined. ABOUT shortcomings we can start talking if the size of the team begins to exceed 12 people and the obtained parameters can only be traced using computer technology.
Another disadvantage is the likelihood of random selection in the indicators if participants in the sociometry process indicate in their answers "I choose everyone". This means two options:
- the person being interviewed has such undifferentiated connections with all members of the group that it does not always correspond to reality;
- the individual gives the wrong answer, trying to show extended loyalty to team members or the instructor.
Parametric verification system
 Some researchers try to change survey parameters to reduce the likelihood of random responses and set a limit on the number of selections. This the method is effective for groups with a large number of people. The subject is asked to choose only a few options. The number of responses allowed is called the sociometric or election limit. According to many experts, this increases the reliability and validity of the results obtained.
When setting a limit, the survey participant tries more attentively choose answers and evaluate colleagues by their leadership qualities. If in the first case the test result could include members whom everyone is trying to kill in the team, then in the second case the roles are distributed more responsibly.
The disadvantages of the parametric version of sociometry by J. Moreno include the inability to trace all psychological dependencies in a team; only those connections that are of greatest importance appear. The introduction of restrictions on the number of answers does not allow us to recreate the full emotional coloring of the relationships between team members.
Sociometric card
 A sociometric card is made at the final stage of the study. It is needed to determine the opinion of each group member on specific criteria, for example, about working shoulder to shoulder, holding entertainment events, corporate events, etc. Survey participants answer questions that are drawn up depending on the developed program of the study and the type of team participating in the study . This could be a production site, leisure associations, temporary teams, stable groups.
If such a sociometric question according to J. Moreno is carried out without significant restrictions, then after the question there is enough space on the card for complete answers. Under the restriction conditions, they set the number of columns allowed for the answer of a sociometry participant.
Obtaining results and processing sociometry data by J. Moreno
After collecting information by filling out cards, their processing begins in a mathematical way. To select a data processing option, several methods have been defined:
- using tables;
- graphic;
- indexological.
Method of compiling tables (sociomatrix)
First, draw a simple table called sociomatrix, in which the survey results are entered using symbols. The columns of the table are filled in separately with the results of personal and business relationships. Having analyzed the results from the sociomatrix, they derive accurate picture emotional and psychological relationships in the audited team.
 For a more precise determination, there is experience in constructing summary tables in which the survey picture is presented according to several criteria or election data between groups. TO merits tabular processing of results can include the possibility of obtaining election results in a numerical equivalent, which makes it possible to divide the members of the association depending on the number of elections received by the participant and provided to them for consideration.
Such processing of sociometry results allows us to consider all available options for influence in a team, based on the data obtained, the following indicative sociogram is constructed.
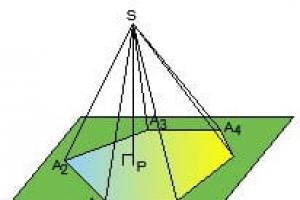
Such a graphic diagram in the form of a round target allows you to visually, and not in the form of mathematical indicators, obtain the distribution of roles among group members. Each circle in the graph is given a specific value:

 A correctly constructed sociogram based on reliable research data will make it possible to determine the presence of various groupings in the formation and establish the boundaries of sociological and psychological contacts. The schematic image will quite clearly visually depict the reactions of the tested group members when constructing answers to the selected sociometric criterion.
A sociogram is a beneficial addition to the tabular method in the study of sociometric material, as it makes it possible to more qualitatively and deeply describe in a visual representation the ongoing optimistic and negative manifestations of interrelated processes in a group.
Analyzing a sociogram usually begins with finding the most influential members of the team and those who support them, then identifying mutual groups, sometimes informal, and non-conflict pairs. The groupings in the graph are represented by those individuals who tend to be chosen in their circle. It is very significant that most often such groups consist of 2-3 team members, more rarely the number is 4 or more.
Application of sociometric indices
To obtain more complete information, sociometric indices are divided into types:
- personal sociometric, showing individual psychological and social manifestations of personality when communicating in a team;
- group, provide quantitative characteristics of a subgroup or configuration when conducting sociometry.
Basic sociological personal indices
These include:
- sociometric indices of i-member status;
- emotionally expansive j-term indices;
- concentration, intensity and volumetric indices of the ij-term.
For convenience, these symbols have definitions that indicate the role of the participant in sociometry, for example, i-denotes the selected member, j is assigned to those who choose, and joint symbols nearby indicate a combination of functions.
 Sociometric status expresses the ability of an individual to be element of group education or formation, which imposes on him the obligation to represent the chosen position in the space of a limited society. In addition, he in one way or another enters into social and psychological relationships with other members of the team.
It is the ability to define oneself in a group of members of the formation that is developed unevenly, therefore, for a more complete representation, a numerical value is used - sociometric index human status. In a group, the elements of interaction are group members who, depending on the character and strength of the individual, interact with other individuals, exchange knowledge, information, and communicate.
 At the same time, the individual behavior of each group member has an effect on the team as a whole, which is manifested through influence on others from the point of view of psychological and social communication. To approach the subjective determination of the quantitative interaction of an individual on a position in a group, the concept of sociometric status was introduced.
But a member of a team can influence other participants from a good and a negative point of view, therefore, when determining status, a characteristic is assigned to him in the form of a positive or negative definition. Status also speaks to a person's ability to become or not become a leader. To calculate the value of sociometric status, indicators are taken from the sociomatrix table.
Socimetry J. Moreno