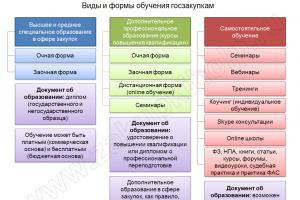
XIII regional scientific forum of young researchers
"Step into the Future - 2010"
Research
quadratic function: its study and plotting.
MOU "Shipakovskaya main
Supervisor:
Mathematic teacher
MOU "Shipakovskaya main
comprehensive school "
Russian Federation
2010
Brief annotation
In this research work, the material on the quadratic function and its properties is presented in an accessible form.
Graphs of 33 quadratic functions different in structure were constructed. Based on the data, a research algorithm was compiled.
Two methods of plotting are presented. Defined its own algorithm for plotting graphs.
When writing research work published materials, the ADVANCED GRAPHER program were used, various graphs were built. I did my research during the last academic year.
Quadratic function: its study and plotting
Russia, Tyumen region, Yurginsky district, with. Shipakovo,
MOU "Shipakovskaya basic comprehensive school", a student of the 9th grade.
annotation
Goal of the work: The study of the properties of a quadratic function, the features of the location of graphs on the coordinate plane, the study of algorithms for constructing graphs of functions on the coordinate plane.
Tasks:
Explore the properties of a quadratic function. To identify what determines the location of the graphs of these functions on the coordinate plane. To study algorithms for constructing a quadratic function. Learn how to quickly and correctly plot quadratic functions on the coordinate plane.
Working methods and techniques:
The study of graphs of quadratic functions, the study of specialized literature, searching for information on the Internet, plotting graphs of quadratic functions using the ADVANCED GRAPHER program.
Data received:
The location of the graphs of quadratic functions depends on the value of a, b, c, the discriminant. There are two ways to build a graph of this function: by points, in an auxiliary coordinate system through the selection of a full square.
Conclusions:
1. If a \u003d 1, then the graph of a quadratic function is a graph y \u003d x2, transferred parallel to the y axis with a vertex at the point (- ;-).
2. If a>0, then the branches of the parabola are directed upwards. If a<0, то ветви параболы направлены вниз.
3. All graphs of quadratic functions have an axis of symmetry passing through the top of the parabola, parallel to the y-axis, or being.
4. To study the graphs, it is enough to know the value of a, the coordinates of the vertex and the point of intersection with the x-axis.
5. If a=1, the coordinates of the vertex are integers, then it is more convenient to build a graph using an auxiliary coordinate system. If not, then build a graph by points.
Quadratic function: its study and plotting
Russia, Tyumen region, Yurginsky district, with. Shipakovo,
MOU "Shipakovskaya basic comprehensive school", a student of the 9th grade.
Research Article
quadratic function is a function that can be defined by a formula of the form
y=ax² + bx +c, Where a≠0.
I decided to plot various graphs of quadratic functions using the ADVANCED GRAPHER program and explore them. I took arbitrary formulas of quadratic functions, different in structure (the formulas of these quadratic functions differ from each other in the values a, b, c). Compared the coordinates of the vertices of the parabola of the constructed graphs and those calculated by the formula (- ; -). And also found the values of the discriminant.
1. Quadratic function: y = x2(elementary quadratic function: a=1, b=0, c=0). (Annex 1)
b=0, c=0
2. Quadratic function: y \u003d 3x2 (a> 0, b \u003d 0, c \u003d 0) (Appendix 2)
3. Quadratic function: y \u003d -3x2 (a<0, b=0, с=0) (Приложение 3)
4. Quadratic function: y \u003d x2 (0<а <1, b=0, с=0) (Приложение 4)
5. Quadratic function: y \u003d -x2 (0> a> 1, b \u003d 0, c \u003d 0) (Appendix 5)
Graphs of quadratic functions for which a > 0,b=0
6. Quadratic function: y \u003d x2 + 4 (a \u003d 1, b \u003d 0, c> 0) (Appendix 6)
7. Quadratic function: y \u003d x2-4 (a \u003d 1, b \u003d 0, c<0) (Приложение 7)
8. Quadratic function: y \u003d 2x2 + 4 (a> 1, b \u003d 0, c> 0) (Appendix 8)
9. Quadratic function: y \u003d 2x2-4 (a> 1, b \u003d 0, c<0) (Приложение 9)
10. Quadratic function: y \u003d x2 + 4 (0<а<1, b=0, с>0) (Annex 10)
11. Quadratic function: y \u003d x2-4 (0<а<1, b=0, с<0) (Приложение 11)
Graphs of quadratic functions for which a<0, b=0
12. Quadratic function: y \u003d - x2 + 5 (a \u003d -1, b \u003d 0, c> 0) (Appendix 12)
13. Quadratic function: y \u003d - x2-5 (a \u003d -1, b \u003d 0, c<0) (Приложение 13)
14. Quadratic function: y \u003d -2x2 + 5 (a<-1, b=0, с>0) (Annex 14)
15. Quadratic function: y \u003d -2x2-5 (a<-1, b=0, с<0) (Приложение 15)
16. Quadratic function: y \u003d -x2 + 5 (0> a> -1, b \u003d 0, c> 0) (Appendix 16)
17. Quadratic function: y \u003d -x2-5 (0> a> -1, b \u003d 0, c<0) (Приложение 17)
Graphs of quadratic functions for whichb≠0, s=0
18. Quadratic function: y \u003d x2 + 3x (a \u003d 1, b≠0, c \u003d 0) (Appendix 18)
19. Quadratic function: y \u003d - x2 + 3x (a \u003d 1, b≠0, c \u003d 0) (Appendix 19)
20. Quadratic function: y \u003d 2x2 + 3x (a> 1, b≠0, c \u003d 0) (Appendix 20)
21. Quadratic function: y \u003d -2x2 + 3x (a<-1, b≠0, с=0) (Приложение 21)
22. Quadratic function: y \u003d x2 + 3x (0<а<1, b≠0, с=0) (Приложение 22)
23. Quadratic function: y \u003d -x2 + 3x (0>a>1, b≠0, c=0) (Appendix 23)
Graphs of quadratic functions with a=1,b≠0, c≠0
24. Quadratic function: y \u003d x2 + 4x-5 (a> 0, b≠0, c≠0) (Appendix 24)
25. Quadratic function: y \u003d x2 + 4x + 5 (a> 0, b≠0, c≠0) (Appendix 25)
26. Quadratic function: y \u003d x2 + 4x + 4 (a> 0, b≠0, c≠0) (Appendix 26)
Graphs of quadratic functions, in which a \u003d -1,b≠0, c≠0
27. Quadratic function: y \u003d - x2 + 4x + 5 (a<0, b≠0, с≠0) (Приложение 27)
28. Quadratic function: y \u003d - x2-4x-5 (a<0, b≠0, с≠0) (Приложение 28)
29. Quadratic function: y \u003d - x2-4x-4 (a<0, b≠0, с≠0) (Приложение 29)
Graphs of quadratic functions for which a≠1,b≠0, c≠0
30. Quadratic function: y \u003d 2x2 + 6x + 5 (a\u003e 1, b≠0, c≠0) (Appendix 30)
31. Quadratic function: y \u003d -2x2 + 6x + 5 (a< -1, b≠0, с≠0) (Приложение 31)
Graphs of quadratic functions that have -1<а<1, b≠0, c≠0
32. Quadratic function: y \u003d x2 + 6x + 15 (0<а <1, b≠0, с≠0) (Приложение 32)
33. Quadratic function: y \u003d -x2 + 6x> a > -1, b≠0, c≠0) (Appendix 33)
The graphs of all quadratic functions are parabolas. If a > 0 , then the branches of the parabola are directed upwards. If a< 0, then the branches of the parabola are directed upwards. Top of the parabola
y \u003d ax² at the point (0; 0); y \u003d ax² + c at the point (0; c); y \u003d ax² + in and y \u003d ax² + in + c at the point (- ; -).
Axis of symmetry- this is a straight line, relative to which all points of the function graph are located symmetrically. All graphs of quadratic functions have an axis of symmetry passing through the vertex. If the function is given by the formula y \u003d ax² or y \u003d ax² + c, then the axis of symmetry is the y axis. If the function is given by the formula y \u003d ax² + bx or y \u003d ax² + bx + c, then the axis of symmetry is the line x \u003d - .
Compression stretching graphs.
Compression: Graph of a function y = af(x) (A> 1) is obtained by stretching the graph of the function y=f(x) along the axis y V A once.
Stretch: Function Graph y = af(x) (0 < A< 1) получается с помощью сжатия графика функции y=f(x) along the axis y in time.
The graph of quadratic functions, with a \u003d 1, is a graph y \u003d x2, transferred parallel to the y axis to the top (- ;-). if a \u003d -1, then it is also symmetrically transferred relative to the straight line y \u003d - (a straight line passing through the vertex, parallel to the x-axis).
The graph of quadratic functions for a > 1, regardless of the value of b and c, is a graph of y \u003d x2, which is stretched along the axis of symmetry in A times from the top, at 0
Dependence of the location of the graph of a quadratic function on the discriminant.
The properties of the function and the type of its graph are determined by the value of a and the discriminant
D = b² - 4 ac.
a > 0, D > 0 | a > 0, D = 0 | a > 0, D < 0 |
https://pandia.ru/text/78/547/images/image007_45.gif" alt="parabola1" align="left" width="192 height=187" height="187">!} 
a < 0, D > 0 | a < 0, D = 0 | a < 0, D < 0 |
https://pandia.ru/text/78/547/images/image010_29.jpg" alt="parabola5" width="196" height="177">!} 
Properties of quadratic functions
1. All quadratic functions have a domain: R, all real numbers.
2. The range of values depends on the value of a: when a > 0 [-;+∞), for a < 0 (-∞;- ] .
3. Even, odd quadratic functions: for b= 0 the function is even (that is, y = ax2+c= a(-x)2+c; when b≠0, then the function is neither even nor odd.
4. Zeros of the function (that is, at what values of the argument, the value of the function is 0).
If D> 0, then the graph of the quadratic function has two zeros: x1=; x2=
and the graph of the function intersect the x-axis at 2 points.
If D= 0, then the graph of the quadratic function has one zero: x = -;
and the graph of the function touches the x-axis at the point (- ; 0)
If D < 0, то график квадратичной функции не имеет нулей, график не пересекает ось х.
5. Intervals of constancy (intervals from the domain of the function, where the function takes positive or negative values, i.e. y>0 or y<0).
If a>0, D>0, then y>0 for x(-∞; x1)U( x2; +∞); at<0 при хhttps://pandia.ru/text/78/547/images/image014_31.gif" width="13" height="13">(-∞;x)U( x; +∞).
If a>0, D<0, то у>0 for x https://pandia.ru/text/78/547/images/image014_31.gif" width="13" height="13 src="> (x1; x2); y<0 при х(-∞;x1)U( x2; ∞).
If a<0, D =0, то у<0 при х (-∞;x)U( x; ∞).
If a<0, D <0, то у<0 при х https://pandia.ru/text/78/547/images/image014_31.gif" width="13" height="13"> [-;+∞); decreases at x (-∞;- ].
If a<0, функция возрастает при х(-∞;-], decreases at x [- ;+∞).
7. Extrema of the function (points of maximum, minimum) At the points of maximum (minimum), the value of the function is greater (respectively, less) than all its neighboring values.
If a > 0, then the graphs have only a minimum of functions, if a<0 – только максимум функций. Это точки вершины параболы.
If a> 0, then xmin=- ; ymin=-; If a < 0 xmax=-; ymax=-.
Algorithm for studying the properties of a quadratic function
Domain. Value area. Even odd function. Function nulls. Sign intervals. intervals of monotonicity. Function extremes.
After analyzing the plotting of my quadratic functions, I compiled algorithm for plotting graphs of quadratic functions by points (1 way).
We find the abscissa of the top of the parabola using the formula x0 = - . We find the value of y0 using the formula y0 = - . On the coordinate plane we build the vertex of the parabola with coordinates (x0; y0). Let us determine the direction of the branches of the parabola (by the coefficient a). Draw the axis of symmetry of the parabola through its vertex, parallel to the y axis. We select the x values to the left or right of the parabola's axis of symmetry and fill in the table of values. We build points according to the obtained coordinates on the coordinate plane. We build a graph of a quadratic function without restrictions on the extreme points and sign the graph.
I will build according to this algorithm graph y \u003d x2 - 4x + 3
2. D \u003d b2-4ac \u003d (- \u003d 4 y \u003d - = .
4. a>0, the branches of the parabola are directed upwards.
5. The axis of symmetry is straight x = 2.
6. Table of values
7. We build points with the obtained coordinates on the coordinate plane.
Grade 8" href="/text/category/8_klass/" rel="bookmark"> Grade 8 we learned to select a full square in quadratic equations. Elena Nikolaevna even then said that the location of the graph on the coordinate plane depends on this. I decided to check : is it possible to draw up an algorithm for plotting graphs of quadratic functions on the coordinate plane through the selection of a full square.
I studied the equations of my quadratic functions from 18-33 and compared the resulting formulas with the vertices of the constructed graphs:
18. y \u003d x2 + 3x \u003d (x2 + 2 1.5 x + 2.25) - 2.25 \u003d (x + 1.5) 2-2.25 a = 1 vertex (-1,5;-2,25)
19. y \u003d - x2 + 3x \u003d -1 (x2-2 1.5 x +2.25) + 2.25 \u003d -1(x - 1.5)2 +2.25 a = -1 vertex (1,5; 2,25)
20. y \u003d 2x2 + 3x \u003d 2 (x2 + 2 0.75 x + 0.5625) -1.125 \u003d 2(x+0.75)2 -1.125 a = 2
vertex (-0,75;-1,125)
21. y \u003d -2x2 + 3x \u003d -2 (x2-2 0.75 x + 0.5625) + 1.125 \u003d -2(x-0.75)2 +1.125 a = 2
vertex (0,75;1,125)
22. y \u003d x2 + 3x \u003d (x2 + 2 3 x + 9) - 4.5 \u003d (x +3)2 -4.5 a =https://pandia.ru/text/78/547/images/image004_61.gif" width="16 height=41" height="41">x2+3x = -(x2 -2 3 x + 9) + 4.5= -(х -3)2 +4.5 a = -https://pandia.ru/text/78/547/images/image004_61.gif" width="16 height=41" height="41">x2+4x+15 =(x2 +2 6 x + 36) -18+15= (x +6)2 -3 a =https://pandia.ru/text/78/547/images/image004_61.gif" width="16 height=41" height="41">x2+6x-14 = -(x2 -2 6 ) x + 36) +18 -14 = - (x -6)2 +4 a =https://pandia.ru/text/78/547/images/image001_112.gif" width="24" height="41">; n = - . That is, the coordinates of the vertex of the parabola (m; n)
Algorithm for constructing a graph of a quadratic function using an auxiliary coordinate system through the selection of a full square (2nd method).
1. Formula conversion y \u003d ax² + in + c \u003dy \u003d a (x -m)2 +n, where m= - ; n=-
or y \u003d a (x + ) 2 -
2. Graph stretch y=x 2 along the axis at V A
times for a>1, for 0< a < 1 - это сжатие в a once.
If a< 0, произвести ещё и зеркальное отражение графика относительно оси X(the branches of the parabola will be directed downwards).
Transformation result: function graph y=ax 2.
https://pandia.ru/text/78/547/images/image020_21.jpg" width="147" height="193 src=">
y=a(x-m)2 along the axis y by n (up at n> 0 and down at n < 0). Результат преобразования: график функции y = a(x-m) 2+n
https://pandia.ru/text/78/547/images/image026_15.jpg" width="336" height="161 src=">
4. Parallel transfer of the function graph
y = - (x+ 2)2 along the axis y by -1.
Grade 6 "href="/text/category/6_klass/" rel="bookmark"> Grade 6, . - Ed. , M. Education, 2004. “Mathematics” Weekly educational and methodical newspaper, Publishing House “First of September”, No. 48, 2003. “Mathematics” Weekly educational and methodical newspaper, Publishing House “First of September”, No. 7, 1998. Tests and examination tasks in mathematics. Textbook.. - Publishing house "Peter", 2005 "Absolute value".. - M .: Education, 1968. "Functions and plotting" .- M .: Education, 1968. "Problems of increased difficulty in the course of algebra for grades 7-9" .. M .: Education, 1991.
Quadratic function: its study and plotting
Russia, Tyumen region, Yurginsky district, with. Shipakovo,
MOU "Shipakovskaya basic comprehensive school", a student of the 9th grade.
Study plan
Justification of the problem. In the control and measuring materials in algebra in the 9th grade for passing the state final certification in a new form, it turned out that many tasks are encountered in plotting quadratic functions and studying them. When plotting a quadratic function, difficulties arise due to the fact that when compiling a table of values for small, modulo, values of the argument, the values of the function are sometimes very large, modulo, and are not included on the notebook page. Therefore, I decided to investigate: the properties of a quadratic function and what determines the location of graphs of quadratic functions on the coordinate plane; study the algorithms for plotting graphs of these functions and choose the easiest algorithm for plotting a graph of a quadratic function.
Hypothesis:
If I study the properties of a quadratic function, algorithms for constructing graphs, and identify what determines the location of graphs on the coordinate plane, then I can quickly and correctly build graphs of this function by choosing the easiest way to plot; explore this feature.
Method description:
1. Analyzing my quadratic functions, I concluded that to conduct a study of the properties of functions, it is enough to know:
Value a: to determine the directions of the branches of the parabola, compression and stretching of graphs, intervals of constancy;
Coordinates of the parabola vertices: to determine the range of values, intervals of monotonicity, extrema of the function;
Meaning of b: to define even, or neither even nor odd;
Discriminant value: to determine the number of function zeros;
If D< 0, то нулей функции нет;
If D = 0, then the zero of the function one is the vertex of the parabola;
If D > 0, then there are 2 zeros of the function.
Zeros of the function: to determine the intervals of constancy.
2. Working on my topic, I deduced my own way of plotting quadratic function graphs (using an auxiliary coordinate system) according to the following algorithm:
- Find the vertex of the parabola. Construct an auxiliary coordinate system centered at the vertex point. Construct a graph y \u003d x2 at the vertex point. If a > 0, then the branches should be directed upwards.
If a ‹ 0, then the branches are directed downwards.
- If IaI ›1, then stretch the graph about the axis of symmetry a times
If 0 ‹ IaI ‹1, then shrink the graph about the symmetry axis by a times
3. It is convenient to plot quadratic functions in various ways. If a = 1, the vertex coordinates are integers, then using the auxiliary coordinate system. If a ≠ 1, the coordinates of the vertex of the parabola are not integers, then in a way: by points.
4. In algebra lessons in grade 9, after completing this research work, I help my classmates learn these methods for plotting quadratic functions using my methods, and conduct their research.
Result:
In the course of my research work, I compiled an algorithm for studying the properties of a quadratic function and tested it in practice. I learned that quadratic functions can be specified in two ways: ax2 + bx + c and a (x-m) + n. I learned how to build graphs of these functions using 2 algorithms. Revealed what determines the location of the graphs on the coordinate plane. She created a methodological manual “Pitfalls of a Quadratic Function”, which she distributed to the students of her school and presented to other schools. In the future, I plan to explore quadratic functions that have a modulus in the formula.
A quadratic function is a function of the form:
y=a*(x^2)+b*x+c,
where a is the coefficient at the highest degree of the unknown x,
b - coefficient at unknown x,
and c is a free member.
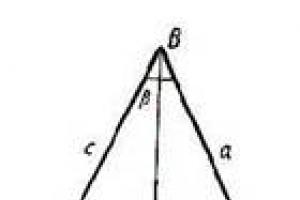
The graph of a quadratic function is a curve called a parabola. The general view of the parabola is shown in the figure below.
Fig.1 General view of the parabola.
There are several different ways to graph a quadratic function. We will consider the main and most general of them.
Algorithm for plotting a graph of a quadratic function y=a*(x^2)+b*x+c
1. Build a coordinate system, mark a single segment and label the coordinate axes.
2. Determine the direction of the branches of the parabola (up or down).
To do this, you need to look at the sign of the coefficient a. If plus - then the branches are directed upwards, if minus - then the branches are directed downwards.
3. Determine the x-coordinate of the top of the parabola.
To do this, you need to use the formula Tops = -b / 2 * a.
4. Determine the coordinate at the top of the parabola.
To do this, substitute the value of the Top found in the previous step in the equation of the Top = a * (x ^ 2) + b * x + c instead of x.
5. Put the resulting point on the graph and draw an axis of symmetry through it, parallel to the coordinate axis Oy.
6. Find the points of intersection of the graph with the x-axis.
This requires solving the quadratic equation a*(x^2)+b*x+c = 0 using one of the known methods. If the equation has no real roots, then the graph of the function does not intersect the x-axis.
7. Find the coordinates of the point of intersection of the graph with the Oy axis.
To do this, we substitute the value x = 0 into the equation and calculate the value of y. We mark this and the point symmetrical to it on the graph.
8. Find the coordinates of an arbitrary point A (x, y)
To do this, we choose an arbitrary value of the x coordinate, and substitute it into our equation. We get the value of y at this point. Put a point on the graph. And also mark a point on the graph that is symmetrical to the point A (x, y).
9. Connect the obtained points on the graph with a smooth line and continue the graph beyond the extreme points, to the end of the coordinate axis. Sign the graph either on the callout, or, if space permits, along the graph itself.
An example of plotting a graph
As an example, let's plot a quadratic function given by the equation y=x^2+4*x-1
1. Draw coordinate axes, sign them and mark a single segment.
2. The values of the coefficients a=1, b=4, c= -1. Since a \u003d 1, which is greater than zero, the branches of the parabola are directed upwards.
3. Determine the X coordinate of the top of the parabola Tops = -b/2*a = -4/2*1 = -2.
4. Determine the coordinate At the top of the parabola
Tops = a*(x^2)+b*x+c = 1*((-2)^2) + 4*(-2) - 1 = -5.
5. Mark the vertex and draw an axis of symmetry.
6. We find the points of intersection of the graph of a quadratic function with the Ox axis. We solve the quadratic equation x^2+4*x-1=0.
x1=-2-√3 x2 = -2+√3. We mark the obtained values on the graph.
7. Find the points of intersection of the graph with the Oy axis.
x=0; y=-1
8. Choose an arbitrary point B. Let it have a coordinate x=1.
Then y=(1)^2 + 4*(1)-1= 4.
9. We connect the received points and sign the chart.
In the lessons of mathematics at school, you have already become acquainted with the simplest properties and the graph of a function y=x2. Let's expand our knowledge quadratic function.
Exercise 1.
Plot a function y=x2. Scale: 1 = 2 cm. Mark a point on the Oy axis F(0; 1/4). Using a compass or strip of paper, measure the distance from the point F to some point M parabolas. Then pin the strip at point M and rotate it around this point so that it becomes vertical. The end of the strip will fall slightly below the x-axis (Fig. 1). Mark on the strip how far it goes beyond the x-axis. Take now another point on the parabola and repeat the measurement again. How much has the edge of the strip now dropped beyond the x-axis?
Result: no matter what point on the parabola y \u003d x 2 you take, the distance from this point to the point F (0; 1/4) will be greater than the distance from the same point to the x-axis always by the same number - by 1/4.
It can be said differently: the distance from any point of the parabola to the point (0; 1/4) is equal to the distance from the same point of the parabola to the line y = -1/4. This wonderful point F(0; 1/4) is called focus parabolas y \u003d x 2, and the straight line y \u003d -1/4 - headmistress this parabola. Each parabola has a directrix and a focus.
Interesting properties of a parabola:
1. Any point of the parabola is equidistant from some point, called the focus of the parabola, and some line, called its directrix.
2. If you rotate a parabola around the axis of symmetry (for example, a parabola y \u003d x 2 around the Oy axis), you get a very interesting surface, which is called a paraboloid of revolution.
The surface of a liquid in a rotating vessel has the shape of a paraboloid of revolution. You can see this surface if you stir hard with a spoon in an incomplete glass of tea, and then remove the spoon.
3. If you throw a stone in the void at a certain angle to the horizon, then it will fly along a parabola (Fig. 2).
4. If you intersect the surface of the cone with a plane parallel to any one of its generators, then in the section you get a parabola (Fig. 3).
 5. In amusement parks, they sometimes arrange a funny attraction called the Paraboloid of Wonders. To each of those standing inside the rotating paraboloid, it seems that he is standing on the floor, and the rest of the people, by some miracle, keep on the walls.
6. In reflecting telescopes, parabolic mirrors are also used: the light of a distant star, traveling in a parallel beam, falling on the telescope mirror, is collected in focus.
7. For spotlights, the mirror is usually made in the form of a paraboloid. If you place a light source at the focus of a paraboloid, then the rays, reflected from the parabolic mirror, form a parallel beam.
Plotting a Quadratic Function
In the lessons of mathematics, you studied how to get graphs of functions of the form from the graph of the function y \u003d x 2:
1) y=ax2– expansion of the graph y = x 2 along the Oy axis in |a| times (for |a|< 0 – это сжатие в 1/|a| раз, rice. 4).
2) y=x2+n– graph shift by n units along the Oy axis, and if n > 0, then the shift is up, and if n< 0, то вниз, (или же можно переносить ось абсцисс).
3) y = (x + m)2– graph shift by m units along the Ox axis: if m< 0, то вправо, а если m >0, then to the left, (Fig. 5).
4) y=-x2- symmetrical display about the Ox axis of the graph y = x 2 .
Let's dwell on plotting a function graph in more detail. y = a(x - m) 2 + n.
A quadratic function of the form y = ax 2 + bx + c can always be reduced to the form
y \u003d a (x - m) 2 + n, where m \u003d -b / (2a), n \u003d - (b 2 - 4ac) / (4a).
Let's prove it.
Really,
y = ax 2 + bx + c = a(x 2 + (b/a) x + c/a) =
A(x 2 + 2x (b/a) + b 2 /(4a 2) - b 2 /(4a 2) + c/a) =
A((x + b/2a) 2 - (b 2 - 4ac)/(4a 2)) = a(x + b/2a) 2 - (b 2 - 4ac)/(4a).
Let us introduce new notation.
Let m = -b/(2a), A n \u003d - (b 2 - 4ac) / (4a),
then we get y = a(x - m) 2 + n or y - n = a(x - m) 2 .
Let's make some more substitutions: let y - n = Y, x - m = X (*).
Then we get the function Y = aX 2 , whose graph is a parabola.
The vertex of the parabola is at the origin. x=0; Y = 0.
Substituting the coordinates of the vertex in (*), we obtain the coordinates of the vertex of the graph y = a(x - m) 2 + n: x = m, y = n.
Thus, in order to plot a quadratic function represented as
y = a(x - m) 2 + n
by transformation, you can proceed as follows:
a) build a graph of the function y = x 2 ;
b) by parallel translation along the Ox axis by m units and along the Oy axis by n units - transfer the top of the parabola from the origin to the point with coordinates (m; n) (Fig. 6).
Write transformations:
y = x 2 → y = (x - m) 2 → y = a(x - m) 2 → y = a(x - m) 2 + n.
Example.
Using transformations, construct a graph of the function y = 2(x - 3) 2 in the Cartesian coordinate system – 2.
Solution.
Chain of transformations:
y=x2 (1) → y = (x - 3) 2 (2) → y = 2(x – 3) 2 (3) → y = 2(x - 3) 2 - 2 (4) .
The construction of the graph is shown in rice. 7.
 You can practice quadratic function plotting by yourself. For example, build a graph of the function y = 2(x + 3) 2 + 2 in one coordinate system using transformations. If you have any questions or want to get advice from a teacher, then you have the opportunity to free 25-minute lesson with an online tutor after registration . For further work with the teacher, you can choose the tariff plan that suits you.
Do you have any questions? Don't know how to graph a quadratic function?
To get the help of a tutor - register.
The first lesson is free!
site, with full or partial copying of the material, a link to the source is required.
Lesson: how to build a parabola or a quadratic function?
THEORETICAL PART
A parabola is a graph of a function described by the formula ax 2 +bx+c=0.
To build a parabola you need to follow simple algorithm actions:
1) Parabola formula y=ax 2 +bx+c,
If a>0 then the branches of the parabola are directed up,
and then the branches of the parabola are directed down.
free member c this point intersects the parabola with the OY axis;
2) , it is found by the formula x=(-b)/2a, we substitute the found x into the parabola equation and find y;
3)Function zeros or in other words, the points of intersection of the parabola with the OX axis, they are also called the roots of the equation. To find the roots, we equate the equation to 0 ax2+bx+c=0;
Types of equations:
a) Complete quadratic equation has the form ax2+bx+c=0 and is solved by the discriminant;
b) Incomplete quadratic equation of the form ax2+bx=0. To solve it, you need to take x out of brackets, then equate each factor to 0:
ax2+bx=0,
x(ax+b)=0,
x=0 and ax+b=0;
c) Incomplete quadratic equation of the form ax2+c=0. To solve it, you need to move the unknown to one side, and the known to the other. x =±√(c/a);
4) Find some additional points to build the function.
PRACTICAL PART
And so now, with an example, we will analyze everything by actions:
Example #1:
y=x 2 +4x+3
c=3 means the parabola intersects OY at the point x=0 y=3. The branches of the parabola look up because a=1 1>0.
a=1 b=4 c=3 x=(-b)/2a=(-4)/(2*1)=-2 y= (-2) 2 +4*(-2)+3=4- 8+3=-1 the top is at the point (-2;-1)
Find the roots of the equation x 2 +4x+3=0
We find the roots by the discriminant
a=1 b=4 c=3
D=b 2 -4ac=16-12=4
x=(-b±√(D))/2a
x1=(-4+2)/2=-1
x2=(-4-2)/2=-3
Let's take some arbitrary points that are near the top x=-2
x -4 -3 -1 0
y 3 0 0 3
We substitute instead of x in the equation y \u003d x 2 + 4x + 3 values
y=(-4) 2 +4*(-4)+3=16-16+3=3
y=(-3) 2 +4*(-3)+3=9-12+3=0
y=(-1) 2 +4*(-1)+3=1-4+3=0
y=(0) 2 +4*(0)+3=0-0+3=3
It can be seen from the values of the function that the parabola is symmetrical about the straight line x \u003d -2
Example #2:
y=-x 2 +4x
c=0 means the parabola intersects OY at the point x=0 y=0. The branches of the parabola look down because a=-1 -1 Find the roots of the equation -x 2 +4x=0
An incomplete quadratic equation of the form ax 2 +bx=0. To solve it, you need to take x out of brackets, then equate each factor to 0.
x(-x+4)=0, x=0 and x=4.
Let's take some arbitrary points that are near the vertex x=2
x 0 1 3 4
y 0 3 3 0
We substitute instead of x in the equation y \u003d -x 2 +4x values
y=0 2 +4*0=0
y=-(1) 2 +4*1=-1+4=3
y=-(3) 2 +4*3=-9+13=3
y=-(4) 2 +4*4=-16+16=0
It can be seen from the values of the function that the parabola is symmetrical about the straight line x \u003d 2
Example #3
y=x 2 -4
c=4 means the parabola intersects OY at the point x=0 y=4. The branches of the parabola look up because a=1 1>0.
a=1 b=0 c=-4 x=(-b)/2a=0/(2*(1))=0 y=(0) 2 -4=-4 vertex is at point (0;-4 )
Find the roots of the equation x 2 -4=0
An incomplete quadratic equation of the form ax 2 +c=0. To solve it, you need to move the unknown to one side, and the known to the other. x =±√(c/a)
x2=4
x1=2
x 2 \u003d -2
Let's take some arbitrary points that are near the top x=0
x -2 -1 1 2
y 0 -3 -3 0
We substitute instead of x in the equation y \u003d x 2 -4 values
y=(-2) 2 -4=4-4=0
y=(-1) 2 -4=1-4=-3
y=1 2 -4=1-4=-3
y=2 2 -4=4-4=0
It can be seen from the values of the function that the parabola is symmetrical about the straight line x=0
Subscribe to the channel on YOUTUBE to keep abreast of all the news and prepare with us for exams.
In many problems, it is required to calculate the maximum or minimum value of a quadratic function. The maximum or minimum can be found if the original function is written in standard form: or through the coordinates of the parabola vertex: f (x) = a (x − h) 2 + k (\displaystyle f(x)=a(x-h)^(2)+k). Moreover, the maximum or minimum of any quadratic function can be calculated using mathematical operations.
Steps
The quadratic function is written in standard form
- In function coefficients a = 1 (\displaystyle a=1) And b = 10 (\displaystyle b=10)
- As a second example, consider the function . Here a = − 3 (\displaystyle a=-3) And b = 6 (\displaystyle b=6). Therefore, calculate the x-coordinate of the top of the parabola as follows:
-
Find the corresponding value of f(x). Substitute the found value of "x" into the original function to find the corresponding value of f(x). This is how you find the minimum or maximum of the function.
- In the first example f (x) = x 2 + 10 x − 1 (\displaystyle f(x)=x^(2)+10x-1) you calculated that the x-coordinate of the top of the parabola is x = − 5 (\displaystyle x=-5). In the original function, instead of x (\displaystyle x) substitute − 5 (\displaystyle -5)
- In the second example f (x) = − 3 x 2 + 6 x − 4 (\displaystyle f(x)=-3x^(2)+6x-4) you found that the x-coordinate of the vertex of the parabola is x = 1 (\displaystyle x=1). In the original function, instead of x (\displaystyle x) substitute 1 (\displaystyle 1) to find its maximum value:
-
Write down the answer. Reread the condition of the problem. If you need to find the coordinates of the vertex of the parabola, write down both values in your answer x (\displaystyle x) And y (\displaystyle y)(or f (x) (\displaystyle f(x))). If you need to calculate the maximum or minimum of a function, write down only the value in your answer y (\displaystyle y)(or f (x) (\displaystyle f(x))). Look again at the sign of the coefficient a (\displaystyle a) to check if you calculated the maximum or minimum.
The quadratic function is written in terms of the coordinates of the vertex of the parabola
-
Write the quadratic function in terms of the coordinates of the vertex of the parabola. Such an equation has the following form:
Determine the direction of the parabola. To do this, look at the sign of the coefficient a (\displaystyle a). If the coefficient a (\displaystyle a) positive, the parabola is directed upwards. If the coefficient a (\displaystyle a) negative, the parabola is pointing down. For example:
Find the minimum or maximum value of the function. If the function is written in terms of the coordinates of the parabola vertex, the minimum or maximum is equal to the value of the coefficient k (\displaystyle k). In the examples above:
Find the coordinates of the vertex of the parabola. If in the problem it is required to find the vertex of the parabola, its coordinates are (h , k) (\displaystyle (h,k)). Note that when a quadratic function is written in terms of the coordinates of the parabola vertex, the subtraction operation must be enclosed in brackets (x − h) (\displaystyle (x-h)), so the value h (\displaystyle h) taken with the opposite sign.
How to calculate the minimum or maximum using mathematical operations
Let us first consider the standard form of the equation. Write the quadratic function in standard form: f (x) = a x 2 + b x + c (\displaystyle f(x)=ax^(2)+bx+c). If necessary, bring like terms and rearrange them to get the standard equation.
Find the first derivative. The first derivative of a quadratic function, which is written in standard form, is equal to f ′ (x) = 2 a x + b (\displaystyle f^(\prime )(x)=2ax+b).
Set the derivative to zero. Recall that the derivative of a function is equal to the slope of the function at a certain point. At minimum or maximum slope zero. Therefore, to find the minimum or maximum value of a function, the derivative must be equated to zero. In our example:
-
Write the function in standard form. A quadratic function is a function whose equation includes a variable x 2 (\displaystyle x^(2)). The equation may or may not include a variable x (\displaystyle x). If an equation includes a variable with an exponent greater than 2, it does not describe a quadratic function. If necessary, bring like terms and rearrange them to write the function in standard form.
The graph of a quadratic function is a parabola. The branches of a parabola point up or down. If the coefficient a (\displaystyle a) with a variable x 2 (\displaystyle x^(2)) a (\displaystyle a)
Calculate -b/2a. Meaning − b 2 a (\displaystyle -(\frac (b)(2a))) is the coordinate x (\displaystyle x) top of the parabola. If the quadratic function is written in the standard form a x 2 + b x + c (\displaystyle ax^(2)+bx+c), use the coefficients for x (\displaystyle x) And x 2 (\displaystyle x^(2)) in the following way: